


THE SINGAPOREAN INVESTOR
Is Broadcom Inc. a Buy?

ljunyuan
Publish date: Thu, 04 Jan 2024, 10:25 AM
ljunyuan
0 388
My name is Jun Yuan, and I am the owner of The Singaporean Investor. I am a full-time retail investor and trader since April 2017, and in this website, I'd be sharing with you my personal analyses of Singapore-listed companies, along with advices relating to investing, as well as trading. You can find out more about me here, and check out my long-term portfolio here.

If you have been following the latest news reports and developments about cloud computing, artificial intelligence/machine learning (AI/ML), then you’re probably familiar with the NASDAQ-listed Broadcom Inc. (NASDAQ:AVGO) – it’s one of the companies that will benefit from this trend, and in my opinion, will continue to remain that way in the next couple of years.
It is for this reason that I have decided to do an in-depth research in the company to find out whether it deserves a place in my long-term investment portfolio.
In this post, I will be sharing with you researches I have done about the company – starting off with an introduction to the company’s businesses, a review of its historical financial performances, debt profile, and dividend payout to shareholders over the last 5 years, whether its current traded price is considered to be ‘cheap’ or ‘expensive’, as well as its ‘fair value’ price based on its 5-year average valuations.
Let’s begin:
A Brief Introduction about Broadcom Inc.
Broadcom Inc is a global technology leader that designs, develops, and supplies a broad range of:
(i) Semiconductor Devices – with its line of products focusing on complex digital and mixed signal Complementary Metal Oxide Semiconductor (or “CMOS” for short) based devices, and analog III-V based products used in enterprise and data centre networking, home connectivity, set-top boxes, broadband access, telecommunication equipment, smartphones and base stations, data centre servers and storage systems, factory automation, power generation and alternative energy systems, and electronic displays;
(ii) Infrastructure Software Solutions – which allows its customers to plan, develop, automate, manage, and secure applications across mainframe, distributed, mobile, and cloud platforms; many of the largest companies in the world (including many of the Fortune 500 companies), and many government agencies rely on the company’s software solutions to help manage and secure their on-premise and hybrid cloud environments.
Also, in November 2023, the company completed the acquisition of cloud software maker VMware.
Finally, do you know that the company’s CEO, Mr Tan Hock Eng (commonly known as Hock E. Tan), is a Malaysian (his birthplace was in Penang)? Also, in 2017, Mr Tan was the highest-earning CEO in the United States, at US$103.2m that year (what an achievement it was!)
Financial Performance
The company has a financial year end on the Sunday closest to 31 October. In this section, I will be taking a look at its total revenue and net profit, gross and net profit margins, as well as its return on equity recorded over the last 5 financial years (between FY2018/19 and FY2022/23):
Total Revenue & Net Profit:
| FY 2018/19 | FY 2019/20 | FY 2020/21 | FY 2021/22 | FY 2022/23 | |
| Total Revenue (US$’mil) | $22,597m | $23,888m | $27,450m | $33,203m | $35,819m |
| Net Profit (US$’mil) | $2,695m | $2,663m | $6,437m | $11,233m | $14,082m |
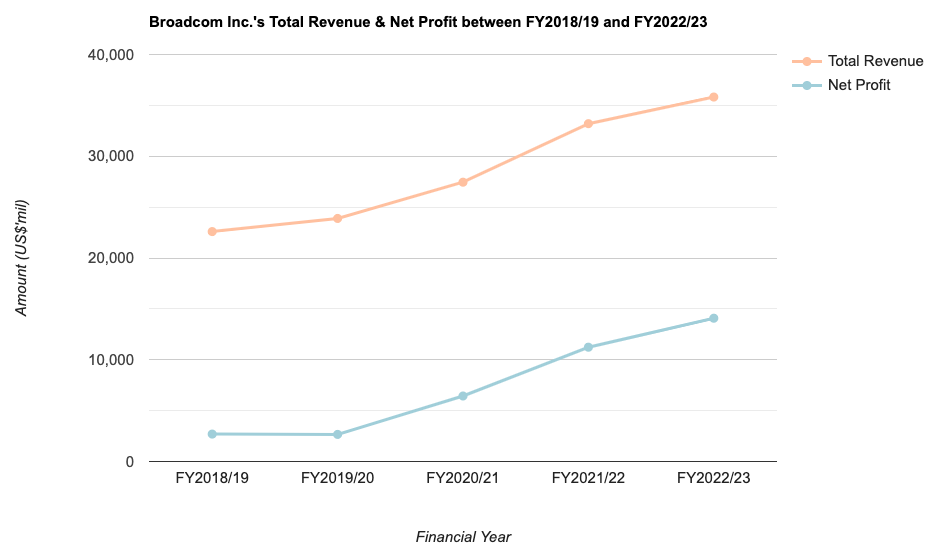
Broadcom’s total revenue saw year-on-year (y-o-y) improvements every single year over the last 5 years, and recording a compound annual growth rate (or CAGR) of 9.7%.
For its net profit, apart from a slight 1.2% dip in FY2019/20 (due to declines in the first 3 quarters of the financial year compared to the year before, partially offset by a strong recovery in the final quarter), the remaining 4 years recorded y-o-y growth. In terms of its CAGR over a 5-year period, it is at a very impressive 39.2%.
Gross & Net Profit Margins:
The following table is Broadcom Inc.’s gross and net profit margins I have computed:
| FY 2018/19 | FY 2019/20 | FY 2020/21 | FY 2021/22 | FY 2022/23 | |
| Gross Profit Margin (%) | 55.2% | 56.6% | 61.4% | 66.5% | 68.9% |
| Net Profit Margin (%) | 11.9% | 11.1% | 23.4% | 33.8% | 39.3% |
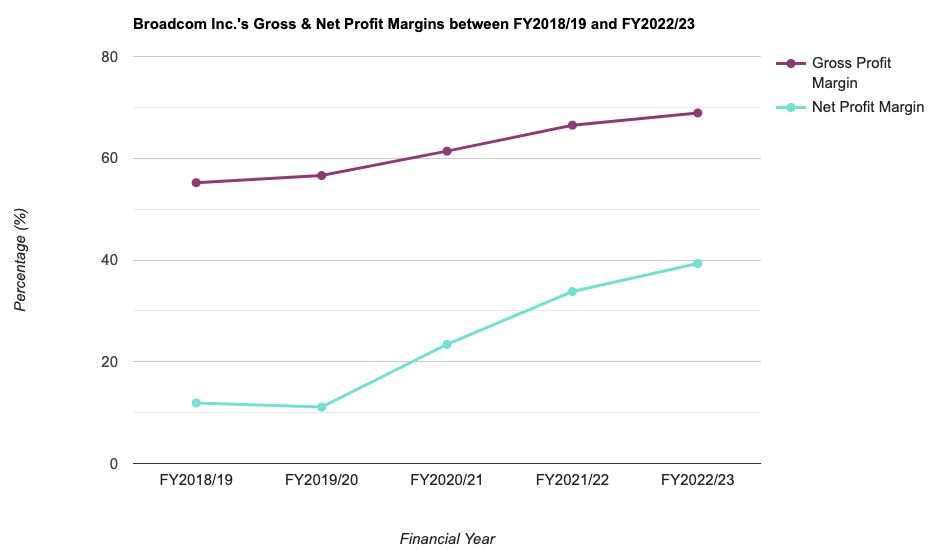
I’m sure you will agree with me that the company’s gross and net profit margin growth over the last 5 year is equally impressive – its gross and net profit margins, at 68.9% and 39.3% respectively, is the highest in the 5-year period I have looked at.
Return on Equity:
For those of you who are unfamiliar with this financial metric, Return on Equity, or RoE for short, is a measure of a company’s ability to generate profits for every dollar of shareholders’ money it uses in its business. Personally, my preference is towards companies that are able to generate a RoE of above 15% over the years.
The following table is Broadcom Inc.’s Return on Equity I’ve computed over the years:
| FY 2018/19 | FY 2019/20 | FY 2020/21 | FY 2021/22 | FY 2022/23 | |
| Return on Equity (%) | 10.8% | 11.2% | 25.8% | 49.5% | 58.7% |
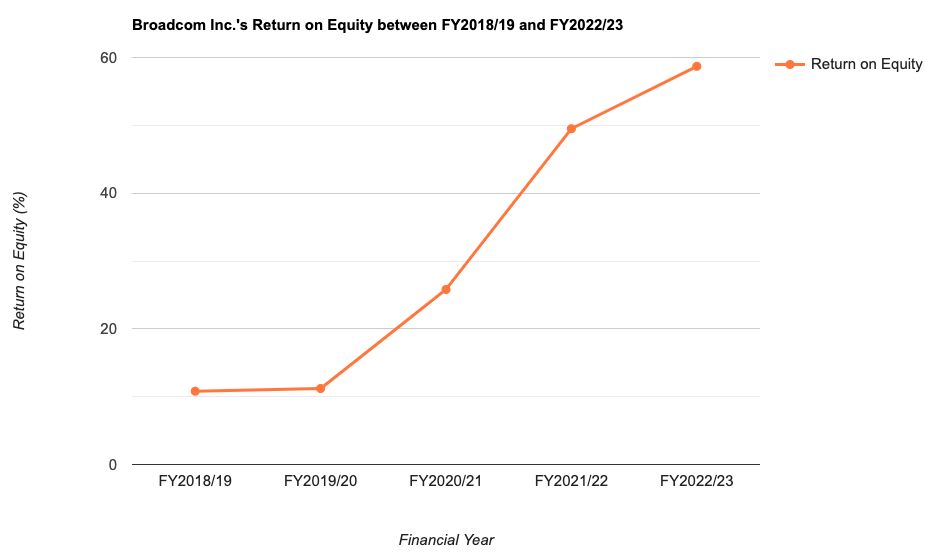
Even though the company’s RoE was under 15.0% in FY2018/19 and FY2019/20, but it still fulfils my criteria for selection as it is a steadily rising one. Also, its RoE between FY2020/21 and FY2022/23 way exceeds my criteria for selection.
Another thing to note is that, the company’s RoE for the latest financial year under review (i.e., FY2022/23 ended 29 October 2023), at 58.7%, is the highest in 5 years, and a very outstanding one (in my personal opinion.)
Debt Profile
When it comes to studying a company, apart from looking at its financial performance, another area I focus on is its debt profile – where my preference is towards those with minimal or no debt, as well as those in a net cash position.
In this section, let us take a look at Broadcom Inc.’s debt profile recorded over the last 5 years (between FY2018/19 and FY2022/23):
| FY 2018/19 | FY 2019/20 | FY 2020/21 | FY 2021/22 | FY 2022/23 | |
| Cash & Cash Equivalent (US$’mil) | $5,055m | $7,618m | $12,163m | $12,416m | $14,189m |
| Total Borrowings (US$’mil) | $32,798m | $41,062m | $39,730m | $39,515m | $39,229m |
| Net Cash/ Debt (US$’mil) | -$27,743m | -$33,444m | -$27,567m | -$27,099m | -$25,040m |

While the company is in a net debt position throughout the entire 5-year period I have looked at, but I noticed a gradual improvement in the most recent 3 financial years – where its net debt position have improved from -$33,444m in FY2019/20 to -$25,040m in the latest financial year under review, FY2022/23.
In terms of its current ratio, it has steadily improved from 1.4 in FY2018/19 to 2.8 in FY2022/23, suggesting that the company is more than able to fulfil any short-term debt obligations if it is required to.
Last but not least, the company’s free cash flow per share (which the company can use to increase its dividend payout to shareholders, conduct share buybacks, or reinvest in its businesses to further improve returns for its shareholders) have also recorded an increase every single year over the last 5 years I have looked at:
| FY 2018/19 | FY 2019/20 | FY 2020/21 | FY 2021/22 | FY 2022/23 | |
| Free Cash Flow Per Share (US$) | $23.28 | $28.50 | $32.25 | $39.02 | $42.59 |

Dividend Payout to Shareholders
The management of Broadcom Inc. declares a dividend payout to its shareholders on a quarterly basis – which is good for dividend investors. However, do take note that if you are a Singaporean investing in a US-listed company, all dividend payouts are subjected to a 30% withholding tax (meaning to say the dividend you receive will be 30% lesser than the amount declared.)
Here is the company’s dividend payout to its shareholders over the last 5 financial years (between FY2018/19 and FY2022/23):
| FY 2018/19 | FY 2019/20 | FY 2020/21 | FY 2021/22 | FY 2022/23 | |
| Dividend Per Share (US$) | $11.20 | $13.35 | $14.90 | $16.90 | $19.05 |

Broadcom have increased its dividend payout by 10+% every single year over the last 5 years, and recording a CAGR of 11.2% – which I consider to be a stable one.
Is the Current Traded Price of Broadcom Inc. Considered ‘Cheap’ or ‘Expensive’?
At the time of writing (04 January 2024), Broadcom Inc. is trading at US$1,058.58.
To find out whether or not it is considered to be a ‘cheap’ or ‘expensive’ price, I will compare its current valuations (based on its current traded price) against its 5-year average valuations to find out:
| Current | 5-Year Average | |
| P/S Ratio | 12.94 | 7.0 |
| P/B Ratio | 21.18 | 8.5 |
| Dividend Yield | 1.8%^^ | 3.2% |
Looking at the above, I would say the current traded price of Broadcom is considered ‘expensive’, as its current P/S and P/B ratios are above its 5-year average, coupled by its current dividend yield being below its 5-year average.
Finally, the ‘fair value’ price of the company I have computed based on its 5-year valuations is US$586.40 – at its current price of US$1,058.58, it is trading at a whooping 80.5% premium.
Closing Thoughts
What’s not to like about the company? It has a growing set of financial results, and dividend payout to its shareholders over the years. This is on top of its steadily rising free cash flow per share position. Outlook for the company in the next few years is also a bright one, as it will continue to benefit from the further growth in cloud computing, as well as AL/ML.
On the other hand, the ongoing ‘chip wars’ between the world’s 2 biggest superpowers – China and the United States of America, could impact its growth, should there be any regulations being passed by the United States government on the sales of chips above a certain capability threshold to China.
Another thing to note is that the company is currently trading at a 80.5% premium to its ‘fair value’ price of US$586.40.
With that, I have come to my review of the NASDAQ-listed Broadcom Inc. I hope the information presented above have given you a good understanding about the company. That said, do take note that everything you have just read is for educational purposes only. They do not represent any buy/sell calls for the company’s shares. You should always do your own due diligence before you make any investment decisions.
Disclaimer: At the time of writing, I am not invested in Broadcom Inc.
The post Is Broadcom Inc. a Buy? first appeared on The Singaporean Investor.
More articles on THE SINGAPOREAN INVESTOR
Mapletree Pan Asia Commercial Trust's 3Q & 9M FY2024/25 Results Review
Created by ljunyuan | Jan 24, 2025
A Review of Frasers Centrepoint Trust's 1Q FY2024/25 Business Update
Created by ljunyuan | Jan 23, 2025
Frasers Centrepoint Trust's Annual Report for FY2023/24 - Key Highlights to Take Note of
Created by ljunyuan | Jan 03, 2025
Discussions
Be the first to like this. Showing 0 of 0 comments
Post a Comment
Featured Posts


Latest Videos


Apps


Top Articles
1
RHB Investment Research Reports
OCBC Bank - All Eyes On Dividend And Capital Management Plans
2
RHB Investment Research Reports
3
THE SINGAPOREAN INVESTOR
Mapletree Pan Asia Commercial Trust's 3Q & 9M FY2024/25 Results Review
4
THE SINGAPOREAN INVESTOR
A Review of Frasers Centrepoint Trust's 1Q FY2024/25 Business Update
5
SGX Market Updates
#
Stock
Score
Daily Stocks
Stock Name
Last
Change
Volume
Stock Name
Last
Change
Volume
Stock Name
Last
Change
Volume
Featured Advertisers / Partners


Ride The Bull Short The Bear
CS Tan
4.9 / 5.0
This book is the result of the author's many years of experience and observation throughout his 26 years in the stockbroking industry. It was written for general public to learn to invest based on facts and not on fantasies or hearsay....