


THE SINGAPOREAN INVESTOR
Johnson & Johnson - What You Need to Know

ljunyuan
Publish date: Mon, 16 Jan 2023, 03:18 PM
ljunyuan
0 388
My name is Jun Yuan, and I am the owner of The Singaporean Investor. I am a full-time retail investor and trader since April 2017, and in this website, I'd be sharing with you my personal analyses of Singapore-listed companies, along with advices relating to investing, as well as trading. You can find out more about me here, and check out my long-term portfolio here.

Johnson & Johnson (NYSE:JNJ) is a name which we should all be familiar with – mainly for its namesake brand of baby powder (however, following lawsuits regarding it, the company have announced an end to the global sales of the product – you can read the news article on this published in August 2022 here.)
In case you’re writing off the company because of this news, I want to let you know that the NYSE-listed company is more than just its namesake brand of baby powder – its revenue comes from 3 business segments, along with some of the products which you’re familiar with, as follows:

(i) Consumer Health – this business segment consists of a range of products focused on personal healthcare under skin health/beauty [e.g. Aveeno, Clean & Clear, Neutrogena, etc.], over-the-counter medicines [e.g. Zyrtec], baby care [e.g. Aveeno Baby], oral care [e.g. Listerine], women’s health [e.g. Carefree sanitary pads], and wound care [e.g. Band-Aid]. However, do take note that in November 2021, the company announced its intention to separate this business segment with the intention to create a new, publicly traded company to be named as Kenvue, to be completed by early November 2023 (you can read the report by Reuters published in September 2022 here);
(ii) Pharmaceutical – this business segment focuses on 6 therapeutic areas – immunology (e.g. rheumatoid arthritis, psoriatic arthritis, inflammatory bowel disease, and psoriasis), infectious diseases (e.g. HIV/AIDS, and Covid-19), neuroscience (e.g. mood disorders, neurodegenerative disorders, and schizophrenia), oncology (e.g. prostate cancer, hematologic malignancies, lung and bladder cancer), cardiovascular and metabolism (e.g. thrombosis, diabetes, and macular degeneration), and pulmonary hypertension (e.g. pulmonary arterial hypertension);
(iii) Medical Devices – this business segment includes a broad range of products used in interventional solutions, orthopaedics, surgery, and vision fields.
In this post, let us take a look at its historical financial performance, debt profile, and dividend payouts over the last 7 financial years (between FY2015/16 and FY2020/21 – the company has a financial year ending every Sunday closest to 31 December), as well as whether its current traded price is considered ‘cheap’ or ‘expensive’.
Let’s begin:
Financial Performance
In this section, I will be looking at several financial numbers – its total revenue and net profit, its gross and net profit margins, and also its return on equity (RoE):
Total Revenue & Net Profit (US$’mil):
| FY 2015/16 | FY 2016/17 | FY 2017/18 | FY 2018/19 | |
| Total Revenue (US$’mil) | $70,074m | $71,890m | $76,450m | $81,581m |
| Net Profit (US$’mil) | $15,409m | $16,540m | $1,300m | $15,297m |
| FY 2019/20 | FY 2020/21 | FY 2021/22 | ||
| Total Revenue (US$’mil) | $82,059m | $82,584m | $93,775m | |
| Net Profit (US$’mil) | $15,119m | $14,714m | $20,878m |

My Observations: Over the last 7 years, Johnson & Johnson’s total revenue saw improvements every single year, and growing at a compound annual growth rate (CAGR) of 4.3% – pretty stable in my opinion.
However, its net profit declined in 3 out of 7 years – in FY2017/18 (by a whooping 92.1% due to an after-tax intangible amortisation expense of approximately $2.5bn, and a charge of after-tax special items of approx $16.2bn), as well as in FY2019/20 and FY2020/21 (where the percentage increase in its cost of sales exceed its total revenue growth) – that said, over the last 7-years, its net profit still managed to record a CAGR of 4.4% – pretty much in-line with the growth of its total revenue over the same time period.
Gross & Net Profit Margins (%):
| FY 2015/16 | FY 2016/17 | FY 2017/18 | FY 2018/19 | |
| Gross Profit Margin (%) | 69.3% | 69.7% | 66.7% | 66.8% |
| Net Profit Margin (%) | 22.0% | 23.0% | 1.7% | 18.8% |
| FY 2019/20 | FY 2020/21 | FY 2021/22 | ||
| Gross Profit Margin (%) | 66.4% | 65.6% | 68.2% | |
| Net Profit Margin (%) | 18.4% | 17.8% | 22.3% |

My Observations: Gross profit margin over the years have been pretty stable at around the 60+% region – meaning to say that the company has managed to control its costs pretty well.
However, its net profit margin in the same time period have been pretty inconsistent.
Return on Equity (%):
Return on Equity, or RoE for short, is a measure of profitability (in percentage terms) for every dollar of shareholders’ money it uses in its business – my preference is towards companies that are able to maintain a RoE of above 15.0%.
The following is Johnson & Johnson’s RoE I’ve computed:
| FY 2015/16 | FY 2016/17 | FY 2017/18 | FY 2018/19 | |
| Return on Equity (%) | 21.7% | 23.5% | 2.2% | 25.6% |
| FY 2019/20 | FY 2020/21 | FY 2021/22 | ||
| Return on Equity (%) | 25.4% | 23.3% | 28.2% |

My Observations: Apart from in FY2017/18 (due to a huge drop in its net profit), all the other years saw Johnson & Johnson managed to maintain its RoE at above 15.0% – which is good to note.
Debt Profile
Apart from its financial performance (which we have looked at in the previous section), another area I will focus my attention at when it comes to reviewing a company’s historical performance is its debt profile – where my preference is towards those that have minimal or no debt (the latter preferred), and also one that is in a net cash position.
Did Johnson & Johnson’s debt profile over the last 7 years fulfil this requirement of mine? Let us find out in the table below:
| FY 2015/16 | FY 2016/17 | FY 2017/18 | FY 2018/19 | |
| Cash & Cash Equivalents (US$’mil) | $13,732m | $18,972m | $17,824m | $18,107m |
| Total Borrowings (US$’mil) | $19,861m | $27,126m | $34,581m | $30,480m |
| Net Cash/ Debt (US$’mil) | -$6,129m | -$8,154m | -$16,757m | -$12,373m |
| FY 2019/20 | FY 2020/21 | FY 2021/22 | ||
| Cash & Cash Equivalents (US$’mil) | $17,305m | $13,985m | $14,487m | |
| Total Borrowings (US$’mil) | $27,696m | $35,266m | $33,751m | |
| Net Cash/ Debt (US$’mil) | -$10,391m | -$21,281m | -$19,264m |

My Observations: Johnson & Johnson is in a net debt position throughout the entire 7-year period – a slight negative for me.
Dividend Payout to Shareholders
The management of Johnson & Johnson declares a dividend payout to its shareholders on a quarterly basis – over the last 7 years, its payout, along with its payout ratio, is as follows:
| FY 2015/16 | FY 2016/17 | FY 2017/18 | FY 2018/19 | |
| Dividend Per Share (US$/share) | $2.95 | $3.15 | $3.32 | $3.54 |
| Dividend Payout Ratio (%) | 53.8% | 53.1% | 706.4% | 63.1% |
| FY 2019/20 | FY 2020/21 | FY 2021/22 | ||
| Dividend Per Share (US$/share) | $3.75 | $3.98 | $4.19 | |
| Dividend Payout Ratio (%) | 66.6% | 72.2% | 53.6% |
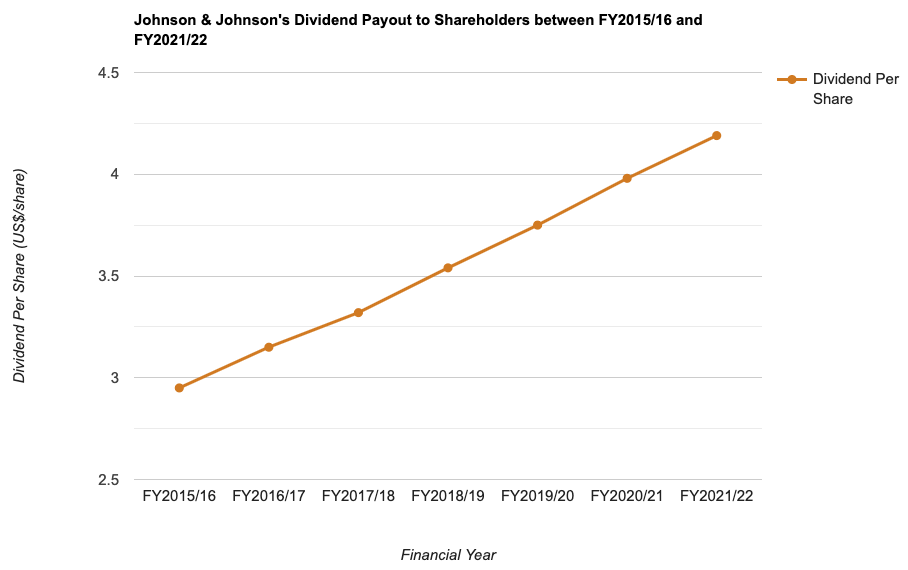
My Observations: One good thing to note is that, Johnson & Johnson’s dividend payout have increased every single year over the last 7 years – growing at a CAGR of 5.1%.
However, do take note that if you are a Singaporean investing in a US company, all dividend payouts declared are subjected to a 30.0% withholding tax – meaning the amount you receive will be 30.0% less than the amount declared.
Is the Current Traded Price of Johnson & Johnson Considered ‘Cheap’ or ‘Expensive’?
As at the end of the trading day on 13 January 2023, Johnson & Johnson’s share price was at US$173.43 – the following table is its current valuations (based on its current traded price) compared with its 7-year average:
| Current | 7-Year Average | |
| P/E Ratio | 17.5 | 62.1 |
| P/B Ratio | 6.1 | 5.6 |
| Dividend Yield | 2.4% ** | 2.6% |
Comparing its current valuations against its 7-year average, the current share price of Johnson & Johnson is considered to be slightly ‘expensive’ – due to its current P/B ratio being higher than its 7-year average, coupled with its dividend yield being lower than its 7-year average.
Closing Thoughts
Every company have their fair share of pros and cons – in the case of Johnson & Johnson, its pros include a stable growth in its revenue (over a 7-year period, it saw a CAGR of 4.3%), its gross profit margin remaining stable at 60+% throughout the entire 7-year period I have looked at, its RoE over the years have been above my requirement of 15.0%, along with its quarterly dividend payout and the fact that its dividend payout have increased every single year; on the other hand, its cons include an irregular net profit and net profit margin growth, along with the company being in a net debt position in all the 7 years I have looked at. Finally, its current traded price is also considered to be ‘expensive’.
With that, I have come to the end of my review of Johnson & Johnson. As always, the information above is purely for educational purposes only, and they do not represent any buy or sell calls for the company’s shares. Please do your due diligence before you make any investment decision.
Disclaimer: At the time of writing, I am not a shareholder of Johnson & Johnson.
More articles on THE SINGAPOREAN INVESTOR
Mapletree Pan Asia Commercial Trust's 3Q & 9M FY2024/25 Results Review
Created by ljunyuan | Jan 24, 2025
A Review of Frasers Centrepoint Trust's 1Q FY2024/25 Business Update
Created by ljunyuan | Jan 23, 2025
Frasers Centrepoint Trust's Annual Report for FY2023/24 - Key Highlights to Take Note of
Created by ljunyuan | Jan 03, 2025
Discussions
Be the first to like this. Showing 0 of 0 comments
Post a Comment
Featured Posts


Latest Videos


Apps


Top Articles
1
RHB Investment Research Reports
OCBC Bank - All Eyes On Dividend And Capital Management Plans
2
RHB Investment Research Reports
3
THE SINGAPOREAN INVESTOR
Mapletree Pan Asia Commercial Trust's 3Q & 9M FY2024/25 Results Review
4
THE SINGAPOREAN INVESTOR
A Review of Frasers Centrepoint Trust's 1Q FY2024/25 Business Update
5
SGX Market Updates
#
Stock
Score
Daily Stocks
Stock Name
Last
Change
Volume
Stock Name
Last
Change
Volume
Stock Name
Last
Change
Volume
Featured Advertisers / Partners


Ride The Bull Short The Bear
CS Tan
4.9 / 5.0
This book is the result of the author's many years of experience and observation throughout his 26 years in the stockbroking industry. It was written for general public to learn to invest based on facts and not on fantasies or hearsay....