


THE SINGAPOREAN INVESTOR
How are the Indexes of Singapore, Hong Kong, and United States Likely to Move in the Near-term?

ljunyuan
Publish date: Mon, 12 Sep 2022, 01:31 PM
ljunyuan
0 356
My name is Jun Yuan, and I am the owner of The Singaporean Investor. I am a full-time retail investor and trader since April 2017, and in this website, I'd be sharing with you my personal analyses of Singapore-listed companies, along with advices relating to investing, as well as trading. You can find out more about me here, and check out my long-term portfolio here.

I have received quite a number of messages from my readers asking for my views on how the indexes of Singapore (the Straits Times Index), Hong Kong (the Hang Seng Index), and the United States (the S&P 500, the Dow Jones Composite Index, and the NASDAQ Index) could move in the near-term.
As it has been quite a while since I’ve done a review on them, I felt it is timely to do it once again – in this post, you’ll read about my technical analysis of how the indexes of these 3 countries could possibly move – both in the bullish, as well as in the bearish scenario, along with some of the key support and resistance points I’ve identified you might want to take note.
On top of that, I’ll also be sharing with you how you can win prizes of up to S$5,000 by sharing your thoughts on how you think the Singapore, Hong Kong, and United States’ indexes could move in the near-term.
Let’s begin:
Straits Times Index (STI)

As you can see from the recent movements above, the STI fell briefly into the correction territory (a market is said to be in a “correction” if it declines by more than 10.0% from its high) in mid-June before recovering to a high of 3,307 points in mid-August 2022, before retracing downwards again.
However, it has broken out of the downtrend line last Thursday (08 September 2022), and continued its upward climb. At the time of writing, the index has broken above the resistance zone (between 3,262 points and 3,270 points) and currently at around 3,271 points.
Now, the big question is how much more could the STI possibly climb – as the stochastic is currently in an “overbought” range, my view is that further upside could be limited (there’s still a chance it it could climb up to the next level of resistance at 3,299 points) – that’s the bullish scenario.
In the bearish scenario, it could retrace down to the resistance-turned-support zone (between between 3,262 points and 3,270 points.) And if it breaks down further, then we could possibly see the index falling back into the red downtrend line (to somewhere around 3,200 points before rebounding once again.)
Hang Seng Index (HSI)
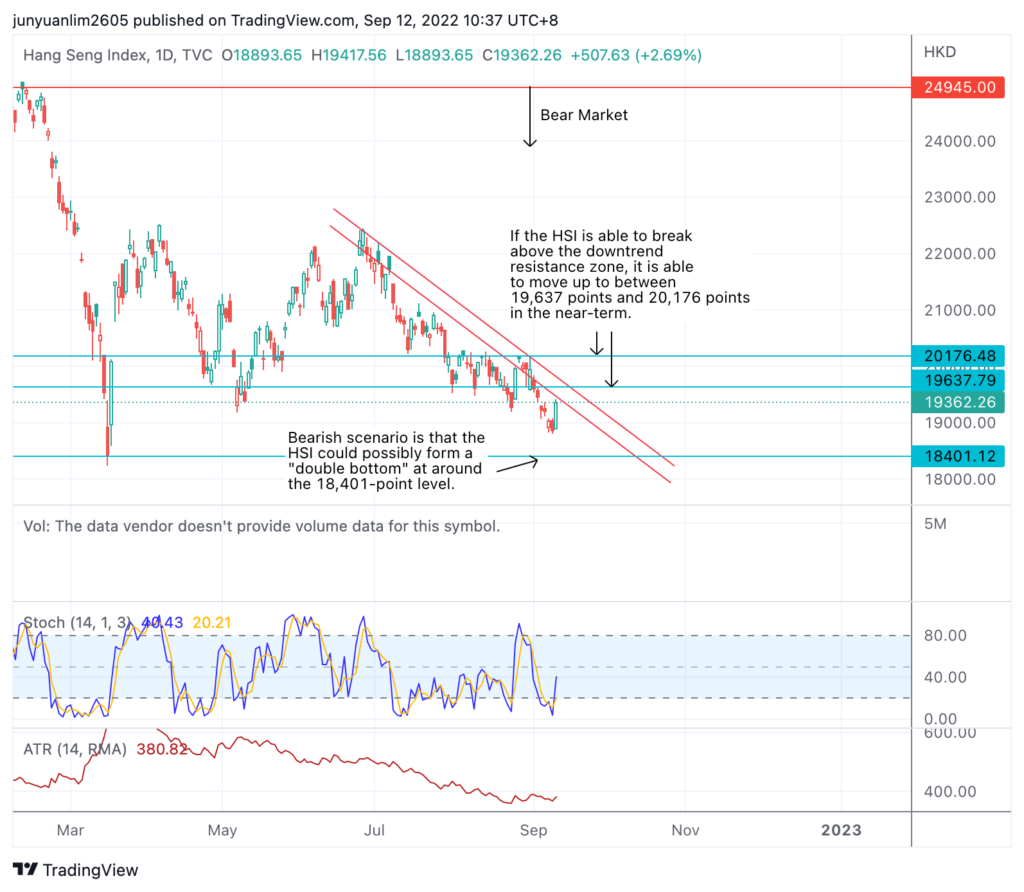
Hong Kong’s benchmark Hang Seng Index is deeply entrenched in a bear market (a market is considered to be in a bear market if it falls by more than 20.0% from its high.)
Also, as you can see from the chart above, the bears are firmly in control (even though the candlestick as at market close last Friday, 09 September 2022, offered a glimmer of hope that the index could see some rebound over the next couple of days [do note that the Hong Kong market is closed today, 12 September 2022 due to observance of Mid-Autumn Festival] – provided it can break above the red downtrend resistance zone.)
My bullish view of the index is that it could trend up to somewhere between the 19,637 points and 20,176 points zone in the near-term (provided it can break above the red downtrend resistance line.)
If it is unable to do so (and retrace down once again), then my view is that the index could potentially form a “double bottom” at around the 18,401-point level before recovering – this is my bearish view.
S&P 500 Index

The S&P 500 Index fell into a bear market around mid-June 2022 – where it hit a low of about 3,636 points before rebounding to around 4,325 points in mid-August 2022 (the index was very close to climbing back into the bull market once again – where anything above 4,336 points will mean that the index is back to the bull market)
Unfortunately, the bears returned and pulled the index down, and at the time of writing, the S&P 500 is on the cusp of breaking out of the red downtrend resistance line.
If the index is able to break above the red downward resistance line, then we could see it attempting to once again climb up to around the 4,336 point level and try to break out of the “correction” market – this is my bullish view.
On the other hand, if the index were to retrace from here, then we could see it decline to where the support level of the green uptrend line is (around the 3,920 point level), or down to 3,854 point level (and if it were to break below this support line; if that happens, then the S&P 500 will be back in the bear market once again.)
Dow Jones Composite Index
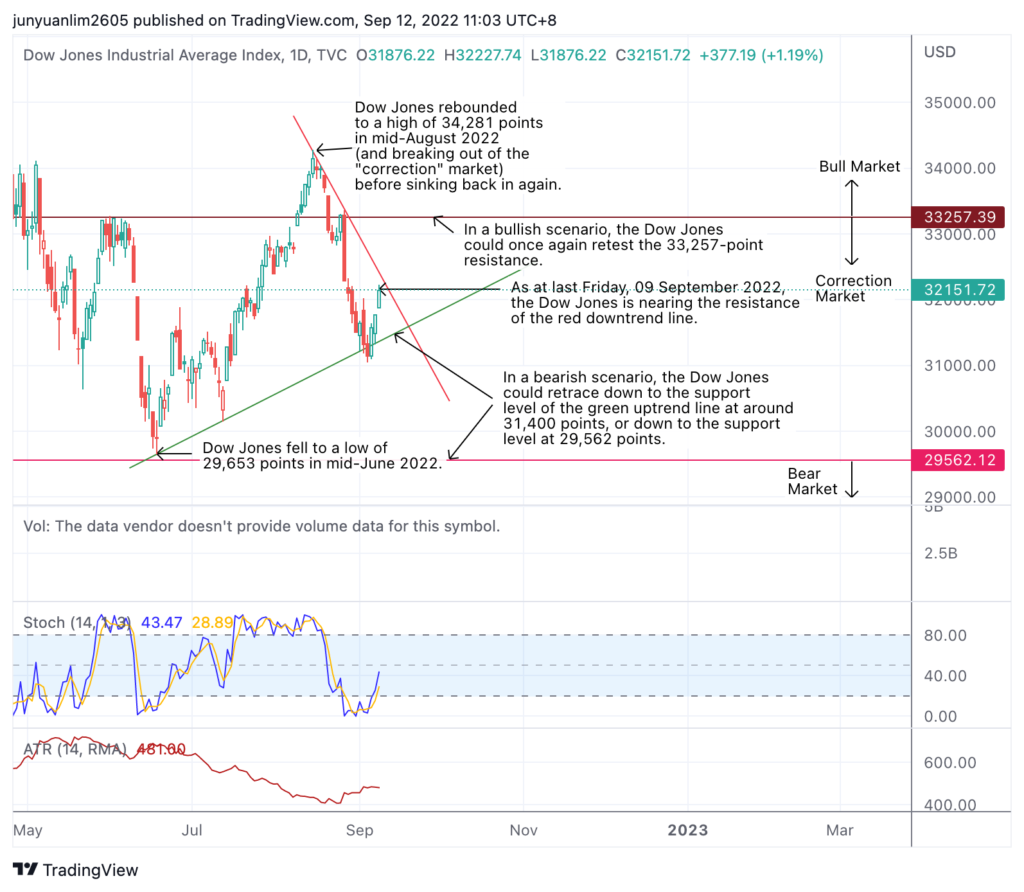
If you look at the recent chart movement of the Dow Jones index, it is very similar to the movement of S&P 500 index (which we have just looked at in the previous section) – it fell to a low (of 29,653 points) in mid-June before rebounding.
However, unlike the S&P 500, the Dow Jones index managed to break out of the “correction” market and into the bull market sometime in mid-August (albeit briefly), to a high of 34,281 points before sinking back into the “correction” market once again.
At the time of writing, the index is nearing the resistance of the red downtrend line – in my opinion, if it is able to break out of this resistance line, then it could once again attempt to break out of the “correction” market and into the bull market (anything above 33,257 points, the Dow Jones index is said to be in the bull market.)
However, if it is unable to break above the red downtrend resistance, then in the near-term, we could see the index retrace down to where the support line of the green uptrend line (at around 31,400 points), or down to 29,562 points (and if it falls further down from this point, the Dow Jones will be in a bear market.)
NASDAQ Index
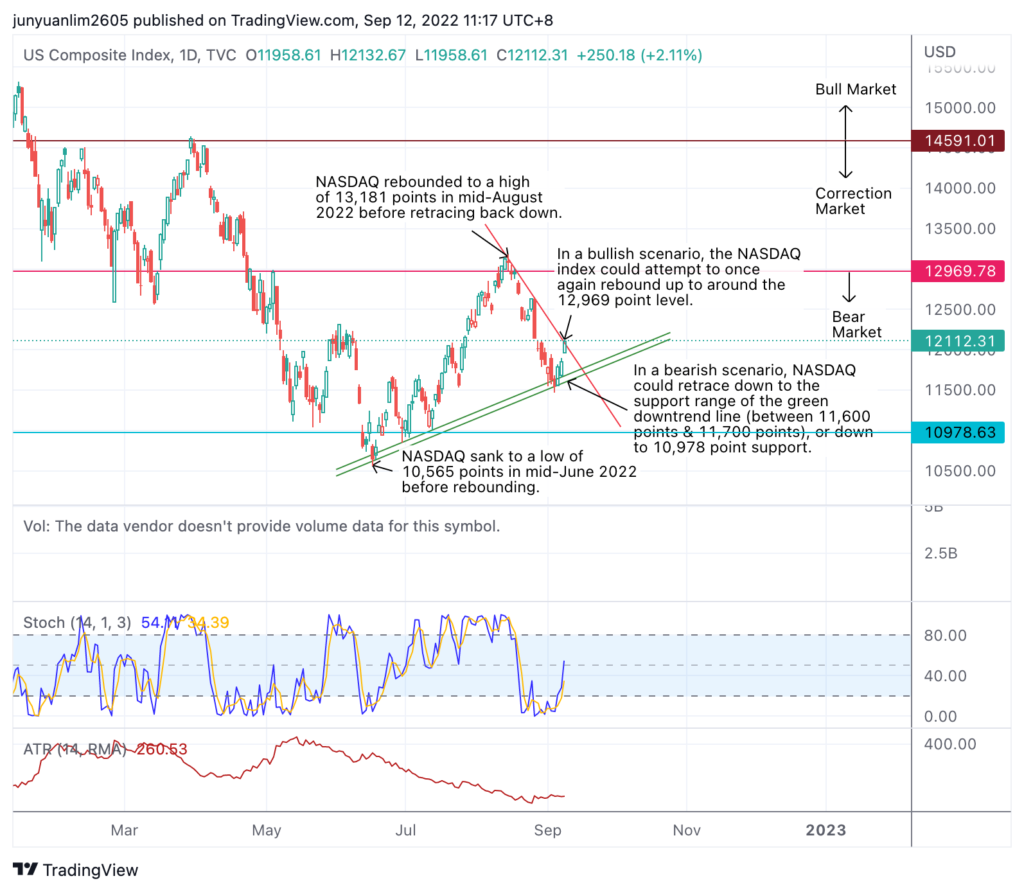
Unlike the S&P 500 and the Dow Jones Indexes, the NASDAQ Index is in a bear market.
However, its movements is similar to the 2 US indexes in that it also sank to a low (of 10,565 points) in mid-June 2022 before rebounding to a high of 13,181 points in mid-August 2022 (and briefly climbing out of the bear market and into the “correction” market territory) and then retraced again.
Also, just like the 2 US indexes (which we have seen in the previous sections), the NASDAQ index is also at somewhere around the resistance of the red downtrend line at the time of writing.
2 scenarios can happen here – in the bullish scenario, the index could break out of the resistance of the red downtrend line and rebound up to around 12,969 points (and attempt to break out of the bear market); alternatively, in the bearish scenario, the index could break down to the support range of the green uptrend line (at around the 11,600 point and 11,700 point range), or down towards the next support line at around 10,978 points.
What Are Your Thoughts about the Index Movements?
The above are my personal thoughts about how the Singapore, Hong Kong, and United States’ indexes could likely move in the near-term – in both bullish as well as bearish scenarios.
What are your thoughts?
From now until 30 September, if you are a member of InvestingNote (if you are not, you can sign up here, it’s free to join!), you can share your thoughts and win up to S$5,000 worth of prizes (some of the prices include Samsung Galaxy Z Fold 4, Nintendo Switch OLED Model, DeLonghi Premium Coffee Machine, Sony Noise-Cancelling Headphones WH1000XM4, Samsonite Premium Near Luggage, and S$200 CapitaLand Voucher).
You can find out more details about how you can win these prizes here.
Disclaimer: All the opinions you’ve read about above are purely mine, which I’m sharing for educational purposes only. They do not represent any buy or sell calls for any of the indexes, or any of the companies that make up the indexes. You’re strongly encouraged to do your own due diligence before you make any investment or trading decisions.
More articles on THE SINGAPOREAN INVESTOR
DBS vs. UOB vs. OCBC: Who Came Out on Top in its Q2 and 1H FY2024 Results?
Created by ljunyuan | Aug 12, 2024
Discussions
Be the first to like this. Showing 0 of 0 comments
Post a Comment
Featured Posts


Latest Videos


Apps


Top Articles
1
RHB Investment Research Reports
ComfortDelGro - Higher Public Transport Fares in Singapore; BUY
2
CEO Morning Brief
Pope Francis, in Singapore, Urges Fair Wages for Migrant Workers
3
reitsnewsletter
4
RHB Investment Research Reports
Pan-United Corp - Beneficiary of Singapore Construction Projects
5
SGX Market Updates
STI Return Above 3,400 Sees Stocks Draw S$760M Net Institutional Inflow
#
Stock
Score
Daily Stocks
Stock Name
Last
Change
Volume
Stock Name
Last
Change
Volume
Stock Name
Last
Change
Volume
Featured Advertisers / Partners


Ride The Bull Short The Bear
CS Tan
4.9 / 5.0
This book is the result of the author's many years of experience and observation throughout his 26 years in the stockbroking industry. It was written for general public to learn to invest based on facts and not on fantasies or hearsay....