


THE SINGAPOREAN INVESTOR
Kellogg Company (NYSE:K) - Is the Company Worthy of a Place in Your Investment Portfolio?

ljunyuan
Publish date: Tue, 06 Sep 2022, 03:52 PM
ljunyuan
0 356
My name is Jun Yuan, and I am the owner of The Singaporean Investor. I am a full-time retail investor and trader since April 2017, and in this website, I'd be sharing with you my personal analyses of Singapore-listed companies, along with advices relating to investing, as well as trading. You can find out more about me here, and check out my long-term portfolio here.

Even though Kellogg Company (NYSE:K) is listed in the New York Stock Exchange, but the company is certainly no stranger to fellow Singaporeans – many of us should familiar with its namesake brand of breakfast cereals. Apart from that, another product which we should be familiar with is the potato chip brand ‘Pringles’ (yes, it is one of the brands under Kellogg Company, and it’s stackable potato chips happen to be one of my personal favourite as well.)
This company caught my investment eye for its easy-to-understand business model – founded in 1906, the company manufactures (in 21 countries) as well as markets its products (which includes snacks such as crackers, savoury snacks, toaster pastries, cereal bars, granola bars, and bites, along with convenience foods such as ready-to-eat cereals, frozen waffles, veggie foods and noodles) in more than 180 countries.
Its snack brands are marketed under brands such as Kellogg’s Cheez-It, Pringles, Austin, Parati, and RXBAR. Its cereals and cereal bars are generally marketed under the Kellogg’s name, with some under Kashi and Bear Naked brands. Finally, its frozen foods are marketed under Eggs and Morningstar Farm brands.
So, is the company worthy of a place in your investment portfolio? To best answer this question, let us have a look at its historical financial performance, debt profile, along with its dividend payouts over the last 7 years (between FY2015/16 and FY2021/22 – the company has a financial year ending on the Saturday closest to 31 December.) On top of that, you’ll also find out whether or not at its current trading price, is the company considered ‘cheap’ or ‘expensive’ based on its current valuations vs. its 7-year average.
Let’s begin.
Financial Performance
Total Revenue & Net Profit (USD$’mil):
| FY 2015/16 | FY 2016/17 | FY 2017/18 | FY 2018/19 | FY 2019/20 | |
| Total Revenue (USD’mil) | $13,525m | $12,965m | $12,854m | $13,547m | $13,578m |
| Net Profit (USD’mil) | $614m | $699m | $1,254m | $1,336m | $960m |
| FY 2020/21 | FY 2021/22 | ||||
| Total Revenue (USD’mil) | $13,770m | $14,181m | |||
| Net Profit (USD’mil) | $1,251m | $1,488m |

My Observations: The company’s total revenue saw year-on-year (y-o-y) improvements in its total revenue in 5 out of 7 years. Another thing to note is that, in the years where the company recorded growth in its total revenue, they were in low single-digit percentages – as a result, over a 7-year period, its total revenue recorded a compound annual growth rate (CAGR) of just 0.7%.
However, its net profit performed better – where it declined only in FY2019/20 (due to higher one-time charges, and absence of results from divested businesses), and over a 7-year period, its net profit recorded a CAGR of 13.5%.
Gross & Net Profit Margin (%):
| FY 2015/16 | FY 2016/17 | FY 2017/18 | FY 2018/19 | FY 2019/20 | |
| Gross Profit Margin (%) | 34.6% | 37.3% | 36.6% | 34.9% | 32.3% |
| Net Profit Margin (%) | 4.5% | 5.4% | 9.8% | 9.9% | 7.1% |
| FY 2020/21 | FY 2021/22 | ||||
| Gross Profit Margin (%) | 34.3% | 32.2% | |||
| Net Profit Margin (%) | 9.1% | 10.5% |

My Observations: Over the last 7 years, Kellogg Company’s gross profit margin has been pretty stable – where it has hoovered at around the 30+% range.
For its net profit margin, it has been on a steady rise (apart from in FY2019/20, where it saw a 2.8 percentage point [pp] decline as a result of a drop in net profit for the financial year), where it grew from a low of 4.5% in FY2015/16 to a high of 10.5% in FY2021/22 (its net profit margin this year is also the highest throughout the entire 7-year period I have looked at.)
Return on Equity (%):
Return on Equity (or ROE for short), expressed in percentage terms, measures a company’s ability to generate profits from shareholders’ money it uses in its businesses. Personally, my preference is towards companies that are able to generate a RoE of 15.0% and above over the years.
The following table is Kellogg Company’s RoE over the years (which I have computed):
| FY 2015/16 | FY 2016/17 | FY 2017/18 | FY 2018/19 | FY 2019/20 | |
| Return on Equity (%) | 28.9% | 36.6% | 57.6% | 51.4% | 34.9% |
| FY 2020/21 | FY 2021/22 | ||||
| Return on Equity (%) | 40.9% | 40.0% |

My Observations: While the company’s RoE have fluctuated over the years (from a low of 28.9% in FY2015/16 to a high of 57.6% in FY2017/18), but it has been way above my investment criteria of 15.0%.
Debt Profile
Other than its financial results, another aspect I look at whenever I study about a company is its debt profile – where my preference is towards companies with minimal or no debt, as well as one that is in a net cash position.
That said, did Kellogg Company’s debt profile over the years meet my criteria for investment? Let us find out in the table below:
| FY 2015/16 | FY 2016/17 | FY 2017/18 | FY 2018/19 | FY 2019/20 | |
| Cash & Cash Equivalents (USD’mil) | $251m | $280m | $281m | $321m | $397m |
| Total Borrowings (USD’mil) | $6,541m | $7,329m | $8,245m | $8,717m | $7,815m |
| Net Cash/ Debt (USD’mil) | -$6,290m | -$7,049m | -$7,964m | -$8,396m | -$7,418m |
| Current Ratio | 0.6 | 0.7 | 0.7 | 0.7 | 0.7 |
| FY 2020/21 | FY 2021/22 | ||||
| Cash & Cash Equivalents (USD’mil) | $435m | $286m | |||
| Total Borrowings (USD’mil) | $7,313m | $6,974m | |||
| Net Cash/ Debt (USD’mil) | -$6,938m | -$6,688m | |||
| Current Ratio | 0.7 | 0.6 |
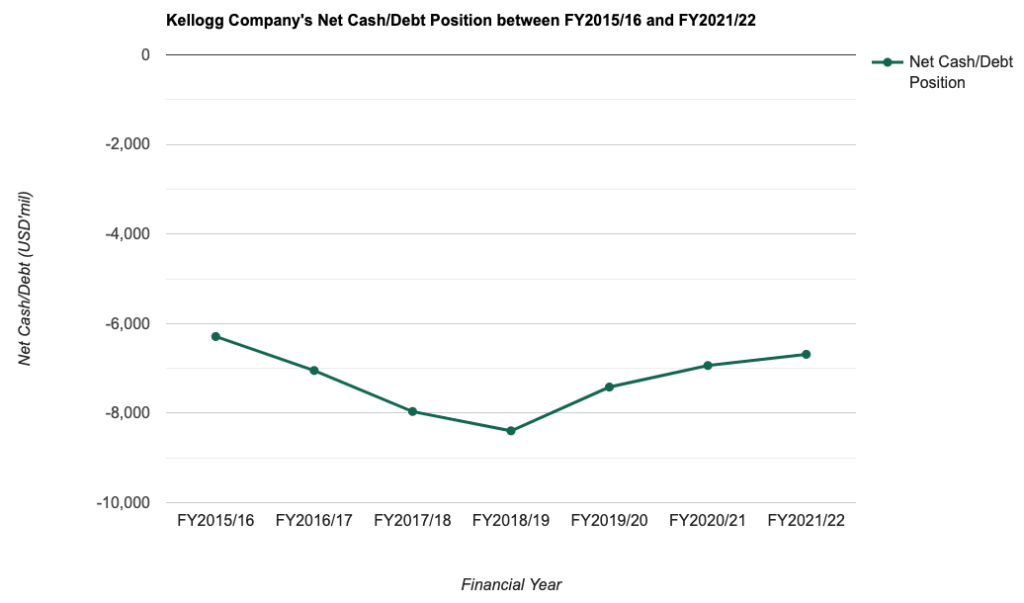
My Observations: While the company is in a net debt position throughout the entire 7-year period, but its total borrowings, since peaking at $8,717m in FY2018/19, have gradually been reduced – which is encouraging to note.
Another thing I’d like to highlight here is its current ratio – where it has been under 1.0 throughout the entire 7-year period – in layman terms, this means that the company could bump into difficulty if it is required to repaying its short-term borrowings (those maturing under a year) within a short notice.
Free Cash Flow/Share (USD/share):
| FY 2015/16 | FY 2016/17 | FY 2017/18 | FY 2018/19 | FY 2019/20 | |
| Free Cash Flow/Share (US$) | $3.25 | $2.18 | -$0.28 | $2.79 | $1.73 |
| FY 2020/21 | FY 2021/22 | ||||
| Free Cash Flow/Share (US$) | $4.31 | $3.36 |
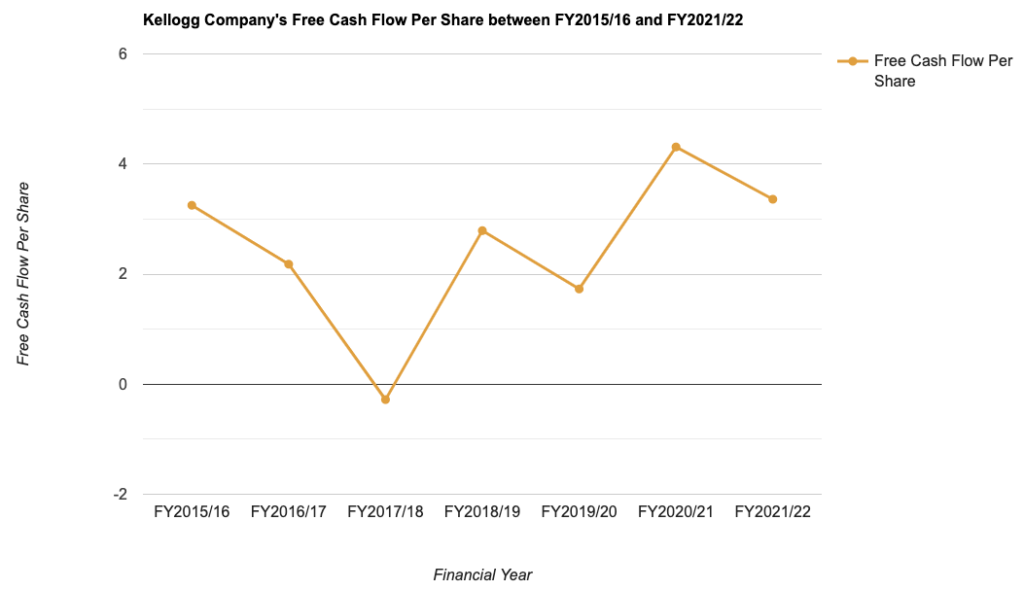
My Observations: Its free cash flow per share have also fluctuated (from a low of -$0.28 in FY2017/18 to a high of $4.31 in FY2020/21) over the years.
Dividend Payout to Shareholders
For those of you who are building a long-term investment portfolio to collect regular dividends, Kellogg Company is definitely one to consider, as the management declares a dividend payout on a quarterly basis (however, do take note that if you are a Singaporean investing in a US company, all dividends are subject to a 30.0% withholding tax – meaning the amount you eventually receive will be 30.0% lesser.)
The following table is the company’s dividend payout to its shareholders over the last 7-years:
| FY 2015/16 | FY 2016/17 | FY 2017/18 | FY 2018/19 | FY 2019/20 | |
| Dividend Per Share (USD) | $1.98 | $2.04 | $2.12 | $2.20 | $2.26 |
| FY 2020/21 | FY 2021/22 | ||||
| Dividend Per Share (USD) | $2.28 | $2.31 |
My Observations: The management of Kellogg Company have increased its dividend payout to shareholders every single year throughout the entire 7-year period – and recording a CAGR of 2.2%.
Is the Current Share Price of Kellogg Company ‘Cheap’ / ‘Expensive’?
At the time of writing, Kellogg Company is trading at US$72.70.
With that, its current vs. its 7-year average valuations is as follows:
| Current | 7-Year Average | |
| P/E Ratio | 17.5 | 24.3 |
| P/B Ratio | 5.5 | 9.3 |
| Dividend Yield | 3.2% ** | 3.3% |
My Observations: Comparing its current against its 7-year average valuations, Kellogg Company is deemed to be ‘cheap’ right now, due to its lower-than-average current P/E and P/B ratios.
Closing Thoughts
To sum up, things about the company that I like include its simple-to-understand business model (where it is in the business of manufacturing and marketing food products such as its namesake Kellogg’s cereals and Pringles potato chips), stable financial performance, and also a steadily rising dividend payout over the years (which have grown at a CAGR of 2.2% over a 7-year period.)
On the other hand, investors who are looking to invest in growth companies (where its revenue are growing at double-digit percentages) may not find the company attractive (where its revenue growth is only at low single-digit percentages overt the years.) Also, the company is in a net debt position throughout the entire 7-year period I have looked at.
Finally, at its current traded price of US$72.70 (at the time of writing of this post), it is considered to be ‘cheap’, due to its P/E and P/B ratios lower than its 7-year average.
With that, I have come to the end of my review of Kellogg Company’s historical performance over the last 7 years. I hope the contents above have given you a better understanding about the US-listed company. Also, do take note that all the opinions above are purely my own for educational purposes only, and not any recommendations to buy or sell shares of the company. You’re strongly encouraged to do your own due diligence before you make any investment decisions.
Disclaimer: At the time of writing, I am not a shareholder of Kellogg Company.
More articles on THE SINGAPOREAN INVESTOR
DBS vs. UOB vs. OCBC: Who Came Out on Top in its Q2 and 1H FY2024 Results?
Created by ljunyuan | Aug 12, 2024
Discussions
Be the first to like this. Showing 0 of 0 comments
Post a Comment
Featured Posts
New Update. Discover investment communities that resonate with your ideas
Trade Confidently & Analyze Charts Conveniently - Download VCPlus IOS & Android App Now!
Latest Videos


Apps


Top Articles
1
RHB Investment Research Reports
ComfortDelGro - Higher Public Transport Fares in Singapore; BUY
2
CEO Morning Brief
Pope Francis, in Singapore, Urges Fair Wages for Migrant Workers
3
reitsnewsletter
4
RHB Investment Research Reports
Pan-United Corp - Beneficiary of Singapore Construction Projects
5
SGX Market Updates
STI Return Above 3,400 Sees Stocks Draw S$760M Net Institutional Inflow
#
Stock
Score
Daily Stocks
Stock Name
Last
Change
Volume
Stock Name
Last
Change
Volume
Stock Name
Last
Change
Volume
Featured Advertisers / Partners


Ride The Bull Short The Bear
CS Tan
4.9 / 5.0
This book is the result of the author's many years of experience and observation throughout his 26 years in the stockbroking industry. It was written for general public to learn to invest based on facts and not on fantasies or hearsay....