


THE SINGAPOREAN INVESTOR
What You Need to Know about General Mills Inc. (NYSE:GIS)

ljunyuan
Publish date: Tue, 30 Aug 2022, 03:49 PM
ljunyuan
0 356
My name is Jun Yuan, and I am the owner of The Singaporean Investor. I am a full-time retail investor and trader since April 2017, and in this website, I'd be sharing with you my personal analyses of Singapore-listed companies, along with advices relating to investing, as well as trading. You can find out more about me here, and check out my long-term portfolio here.

You may not be familiar with the US-listed company General Mills Inc. (NYSE:GIS), but I’m sure these products ring a bell:
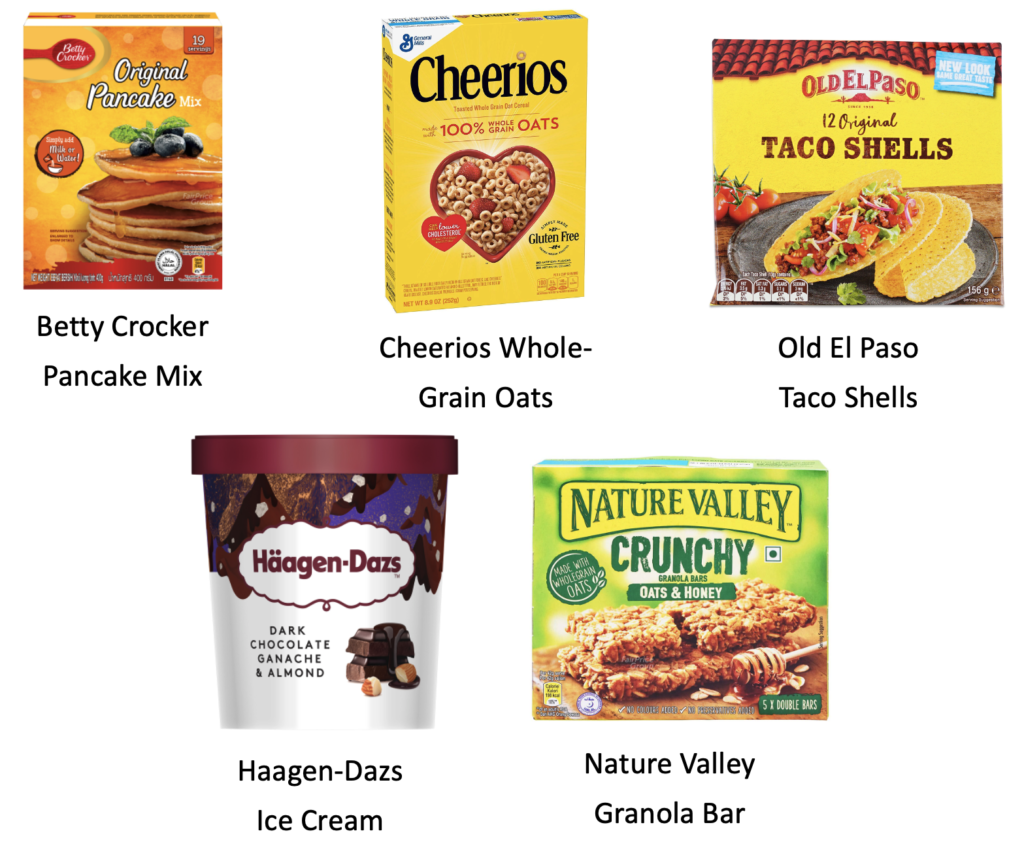
I’m sure you must have seen these products in the major supermarkets when you go grocery shopping (or even have them at home) – they are all by the NYSE-listed company, which is a leading global manufacturer and marketer of branded consumer foods.
Currently, the company owns more than 100 different food brands sold in 100 countries across 6 continents around the world. Apart from that, they also have a 50.0% interest in 2 strategic joint ventures that manufacture and market food products sold in more than 120 countries worldwide.
In this post, you’ll learn more about the company – in terms of its historical financial performance, debt profile, and dividend payout over the past 8 years (between FY2014/15 and FY2021/22 – the company has a financial year ending every last Sunday of May), as well as whether the current share price is currently ‘cheap’/‘expensive’ (through my comparison of its current valuation against its 8-year average.)
Let’s begin:
Financial Performance
Total Revenue & Net Profit (USD’mil):
| FY 2014/15 | FY 2015/16 | FY 2016/17 | FY 2017/18 | |
| Total Revenue (US$’mil) | $17,630m | $16,563m | $15,620m | $15,740m |
| Net Profit (US$’mil) | $1,221m | $1,697m | $1,658m | $2,131m |
| FY 2018/19 | FY 2019/20 | FY 2020/21 | FY 2021/22 | |
| Total Revenue (US$’mil) | $16,865m | $17,627m | $18,127m | $18,993m |
| Net Profit (US$’mil) | $1,753m | $2,181m | $2,340m | $2,707m |
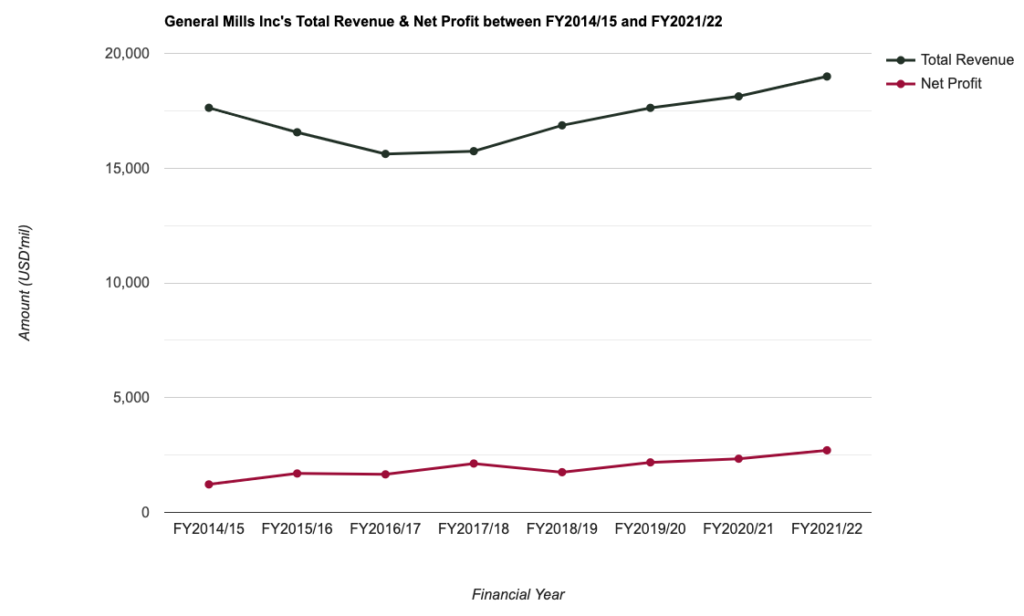
My Observations: Both the company’s total revenue and net profit saw declines in 2 out of the 8 years I have looked at – Despite of that, the former still managed to record a compound annual growth rate (CAGR) of 0.9% (stable growth), with the latter at 10.5%.
Gross & Net Profit Margin (%):
| FY 2014/15 | FY 2015/16 | FY 2016/17 | FY 2017/18 | |
| Gross Profit Margin (%) | 33.7% | 35.2% | 35.6% | 34.5% |
| Net Profit Margin (%) | 6.9% | 10.2% | 10.6% | 13.5% |
| FY 2018/19 | FY 2019/20 | FY 2020/21 | FY 2021/22 | |
| Gross Profit Margin (%) | 34.1% | 34.8% | 35.6% | 33.7% |
| Net Profit Margin (%) | 10.4% | 12.4% | 12.9% | 14.3% |

My Observations: The company’s gross profit margin (in my personal opinion) has remained very stable at the 30+% range (signs of a stable company.)
As far as its net profit margin is concerned, apart from a dip (to 10.4% in FY2018/19), it has been on an upward climb over the last 8-years. In fact, its net profit margin of 14.3% in the latest financial year under review (i.e. FY2021/22) is the highest throughout the entire 8-year period.
Return on Equity (%):
For those who do not know what Return on Equity (or RoE) is, in layman terms, it is the amount of profits (expressed in percentage terms) a company is able to generate for every dollar of shareholders’ money it uses in its businesses.
Personally, my preference is towards companies that are able to generate a RoE of 15.0% of more over the years. With that, here’s General Mills’ RoE over the past 8 years (which I have computed):
| FY 2014/15 | FY 2015/16 | FY 2016/17 | FY 2017/18 | |
| Return on Equity (%) | 24.4% | 34.4% | 38.3% | 34.7% |
| FY 2018/19 | FY 2019/20 | FY 2020/21 | FY 2021/22 | |
| Return on Equity (%) | 24.8% | 27.1% | 24.7% | 25.7% |
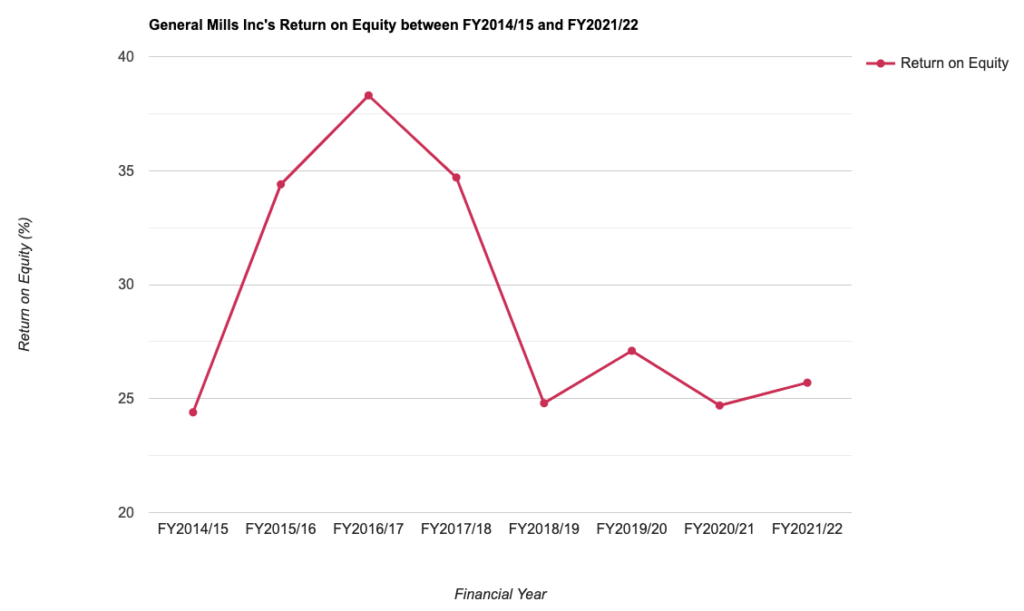
My Observations: While the company’s RoE have fluctuated over the years (between 20+% and 30+% range), but they have met my expectations of being able to maintain at above 15.0%.
Debt Profile
Whenever I study a company, apart from its financial performance, I will also study its debt profile – where my preference is towards companies that are in a net cash position, along with it exhibiting an increase in its free cash flow per share over the years – both of which we will have a look at in this section:
Net Cash/Debt:
| FY 2014/15 | FY 2015/16 | FY 2016/17 | FY 2017/18 | |
| Cash & Cash Equivalent (US$’mil) | $334m | $764m | $766m | $399m |
| Total Borrowings (US$’mil) | $8,608m | $8,161m | $8,248m | $14,269m |
| Net Cash/ Debt (USD’mil) | -$8,274m | -$7,397m | -$7,482m | -$13,870m |
| FY 2018/19 | FY 2019/20 | FY 2020/21 | FY 2021/22 | |
| Cash & Cash Equivalent (US$’mil) | $450m | $1,678m | $1,505m | $569m |
| Total Borrowings (US$’mil) | $13,021m | $13,261m | $12,251m | $10,809m |
| Net Cash/ Debt (USD’mil) | -$12,571m | -$11,583m | -$10,746m | -$10,240m |
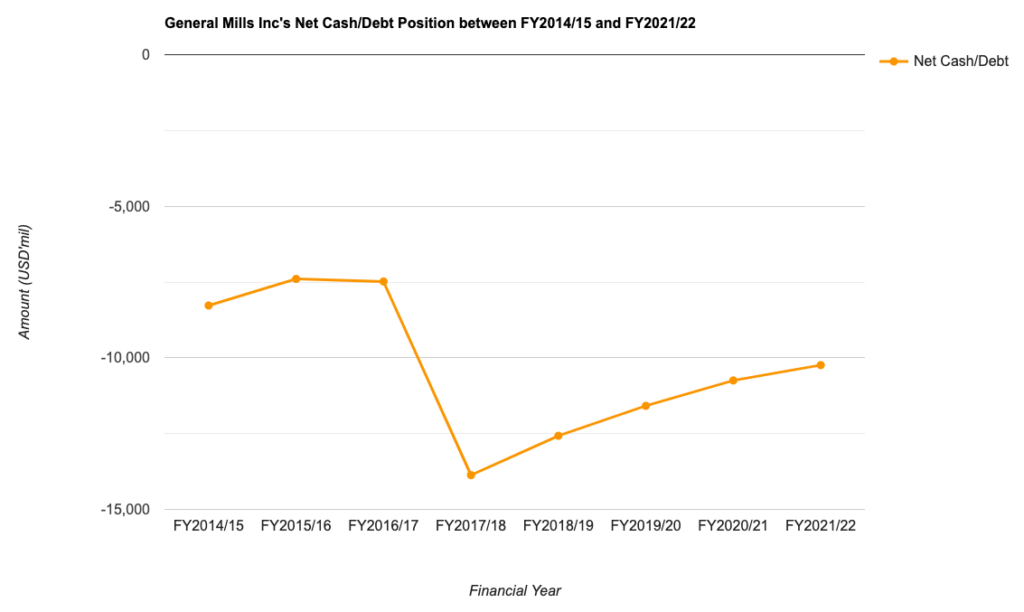
My Observations: The company has been in a net debt position throughout the entire 8-year period. The only consolation I can draw from the stats above is that since its net debt position hit a high of -$13,870m in FY2017/18, it has been improved in the years thereafter.
Also, another thing to note is that, the company’s current ratio (which I have computed) have been between the range of 0.6 and 0.8 throughout the entire 8-year period – which means the company may have problems in meeting its near-term debt obligations (meaning debt that is maturing within a year) if it is required to fulfil them on a short notice – so this is something to be mindful of.
Free Cash Flow Per Share:
| FY 2014/15 | FY 2015/16 | FY 2016/17 | FY 2017/18 | |
| Free Cash Flow/Share (US$) | $3.06 | $3.41 | $3.00 | $3.74 |
| FY 2018/19 | FY 2019/20 | FY 2020/21 | FY 2021/22 | |
| Free Cash Flow/Share (US$) | $3.77 | $5.27 | $4.04 | $4.59 |

My Observations: While its free cash flow per share suffered from year-on-year dips in 2 out of 8 years, but on the whole, it has managed to grow from $3.06 in FY2014/15 to a high of $4.59 (in fact, it is the highest over the 8-year period) in FY2021/22 – a CAGR of 2.5% (pretty stable growth in my opinion.)
Dividend Payout to Shareholders
The management of General Mills declare a dividend payout to its shareholders on a quarterly basis (which is good for those who are looking to invest in companies that pays out a dividend in such a time frequency) – however, do take note that if you are a Singaporean investing in US-listed companies, all dividend payouts are subject to a 30.0% withholding tax (meaning the amount you receive will be 30.0% less than what was declared.)
With that, let us take a look at the company’s dividend payout over the last 8 financial years:
| FY 2014/15 | FY 2015/16 | FY 2016/17 | FY 2017/18 | |
| Dividend Per Share (US$) | $1.67 | $1.78 | $1.92 | $1.96 |
| FY 2018/19 | FY 2019/20 | FY 2020/21 | FY 2021/22 | |
| Dividend Per Share (US$) | $1.96 | $1.96 | $2.02 | $2.04 |
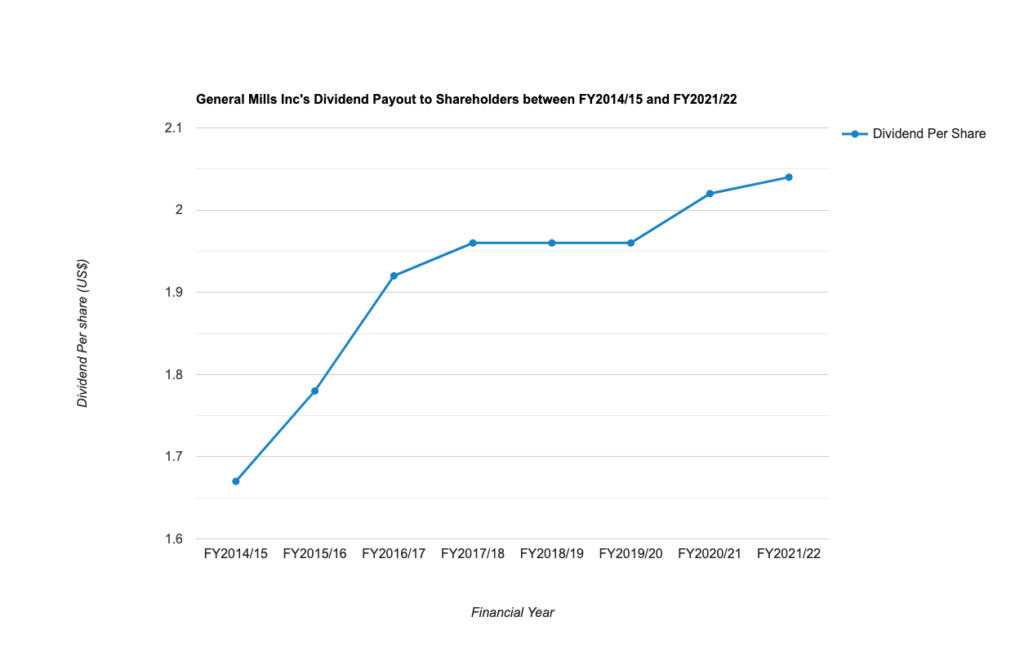
My Observations: While its dividend payout have remained stagnant between FY2017/18 and FY2019/20 (at $1.96/share), but over the entire 8-year period, it has grown from $1.67/share in FY2014/15 to $2.04/share in FY2021/22 – a CAGR of 2.5% (again I consider its payout to be stable.)
Is the Current Share Price of General Mills Considered ‘Cheap’/‘Expensive’?
How I determine whether or not the current share price of a company is considered to be ‘cheap’ or ‘expensive’ is by comparing its current (based on its current traded price of $76.32) vs. its historical valuation (I will be looking at the company’s 8-year historical valuation in this post), and you can find it in the table below:
| Current Valuation | 8-Year Average | |
| P/E Ratio | 12.3 | 19.0 |
| P/B Ratio | 2.4 | 5.4 |
| Dividend Yield | 2.7% ** | 3.3% |
My Observations: Comparing its current valuations and its 8-year average, General Mills’ current share price is considered to be ‘cheap’.
Closing Thoughts
Some of the aspects of General Mills that caught my investment eye include the company having an easy-to-understand business (in that they are one of the leading manufacturers and marketers of food products, and some of these products can be found in the major supermarkets in Singapore), stable growth in its financial performance and dividend payout to shareholders over the years.
On the other hand, its debt profile is something you need to mindful of – with the company being in a net debt position in all of the 8 financial years I have looked at, as well as its current ratio at below 1.0 in the same time period (meaning it could bump into difficulties in fulfilling its short-term debt obligations if it is required to do so in a short-period of time.)
With that, I have come to the end of my sharing about General Mills today. Do take note that all the opinions in this post are solely mine for educational purposes only. They do not represent any buy or sell calls for the company’s shares. As always, you should do your own due diligence before you engage in any investment decisions.
Disclaimer: At the time of writing, I am not a shareholder of General Mills Inc.
More articles on THE SINGAPOREAN INVESTOR
DBS vs. UOB vs. OCBC: Who Came Out on Top in its Q2 and 1H FY2024 Results?
Created by ljunyuan | Aug 12, 2024
Discussions
Be the first to like this. Showing 0 of 0 comments
Post a Comment
Featured Posts
New Update. Discover investment communities that resonate with your ideas
Trade Confidently & Analyze Charts Conveniently - Download VCPlus IOS & Android App Now!
Latest Videos


Apps


Top Articles
1
RHB Investment Research Reports
ComfortDelGro - Higher Public Transport Fares in Singapore; BUY
2
CEO Morning Brief
Pope Francis, in Singapore, Urges Fair Wages for Migrant Workers
3
reitsnewsletter
4
RHB Investment Research Reports
Pan-United Corp - Beneficiary of Singapore Construction Projects
5
SGX Market Updates
STI Return Above 3,400 Sees Stocks Draw S$760M Net Institutional Inflow
#
Stock
Score
Daily Stocks
Stock Name
Last
Change
Volume
Stock Name
Last
Change
Volume
Stock Name
Last
Change
Volume
Featured Advertisers / Partners


Ride The Bull Short The Bear
CS Tan
4.9 / 5.0
This book is the result of the author's many years of experience and observation throughout his 26 years in the stockbroking industry. It was written for general public to learn to invest based on facts and not on fantasies or hearsay....