


THE SINGAPOREAN INVESTOR
Why Do I Continue to Fancy Sheng Siong Group Limited (Updated 2022)

ljunyuan
Publish date: Wed, 09 Mar 2022, 03:37 PM
ljunyuan
0 356
My name is Jun Yuan, and I am the owner of The Singaporean Investor. I am a full-time retail investor and trader since April 2017, and in this website, I'd be sharing with you my personal analyses of Singapore-listed companies, along with advices relating to investing, as well as trading. You can find out more about me here, and check out my long-term portfolio here.

Sheng Siong Group Limited (SGX:OV8) was one of the beneficiaries of the Covid-19 pandemic – particularly in 2020 when the Singapore government imposed a 2-month “circuit breaker” (between 07 April and 01 June 2020), and subsequently, maintaining its work from home recommendation for those who are able to do so for the remaining months of the year – this led to a significant increase in demand for daily necessities sold by the supermarket chain as people stayed at home, and at the same time, prepare their own meals at home.
Fast forward to today, some of the measures have been relaxed following Singapore achieving its vaccination target – among them include vaccinated travel lanes with a number of countries (allowing fully vaccinated individuals to visit countries to which Singapore has established vaccinated travel lanes with without the need for any quarantine when they visit, and subsequently when they return), and also more importantly, working from home is now no longer the default (where up to 50% of those who are previously working from home can once again return to their workplace.) With that, the demand for the daily necessities sold by Sheng Siong will once again slowly return to pre-pandemic levels as people start living their lives as they were before virus came into our shores.
I have previously written about the company in 2020 (you can read it here), but as almost 2 years has passed since I’ve written the post, I thought I should update it with results posted in FY2020, as well as in FY2021 to find out whether or not the company’s business fundamentals have continued to remain resilient.
Let’s begin:
Introduction to Sheng Siong Group Limited
The supermarket chain needs no further introduction – it is one of the largest supermarket chains in Singapore, where it offers over 1,400 products under its 23 house brands, ranging from food products to paper goods.
At the time of writing, it has 64 outlets spread across the island. This is on addition to another 4 outlets it has in China (compared to in FY2020, where it has 63 chains in Singapore, and 2 in China.)
Financial Performance (FY2012 to FY2021)
In this section, I will be looking at some of Sheng Siong’s key financial figures reported over a 10-year period – between FY2012 and FY2021:
Revenue, and Net Profit Attributable to Shareholders (S$’mil):
| FY2012 | FY2013 | FY2014 | FY2015 | |
| Gross Revenue (S$’mil) | $637.3m | $687.4m | $726.0m | $764.4m |
| Net Profit Attributable to Shareholders (S$’mil) | $41.7m | $38.9m | $47.6m | $56.8m |
| FY2016 | FY2017 | FY2018 | FY2019 | |
| Gross Revenue (S$’mil) | $796.7m | $829.9m | $890.9m | $991.3m |
| Net Profit Attributable to Shareholders (S$’mil) | $62.7m | $69.8m | $70.8m | $75.7m |
| FY2020 | FY2021 | |||
| Gross Revenue (S$’mil) | $1,394.0m | $1,369.8m | ||
| Net Profit Attributable to Shareholders (S$’mil) | $138.7m | $132.8m |

I’m sure you’d agree with me that Sheng Siong’s financial performance over a 10-year period is a pretty stable one – with its revenue recording growth every single year except for the latest financial year under review (i.e. FY2021, due to a high base last year), and its net profit attributable to shareholders declining in 2 years (in FY2013, and in FY2021 due to reduce government grants.)
In terms of their compound annual growth rates (CAGR) over a 10-year period, its revenue grew at 8%, while its net profit attributable to shareholders grew at 12% – both of them strong growth rates in my opinion.
Gross & Net Profit Margins (%):
The following table is Sheng Siong’s gross and net profit margins I’ve computed:
| FY2012 | FY2013 | FY2014 | FY2015 | |
| Gross Profit Margin (%) | 22.1% | 23.0% | 24.2% | 24.7% |
| Net Profit Margin (%) | 6.5% | 5.7% | 6.6% | 7.4% |
| FY2016 | FY2017 | FY2018 | FY2019 | |
| Gross Profit Margin (%) | 25.7% | 26.2% | 26.8% | 26.9% |
| Net Profit Margin (%) | 7.9% | 8.4% | 7.9% | 7.6% |
| FY2020 | FY2021 | |||
| Gross Profit Margin (%) | 27.4% | 28.7% | ||
| Net Profit Margin (%) | 10.0% | 9.7% |

Looking at its gross and net profit margin, they have also recorded pretty steady growth – particularly, its gross profit margin saw year-on-year (y-o-y) improvements every single year over the past 10 financial years I have looked at.
Return on Equity (%):
Return on Equity (or RoE for short), in layman terms, measures a company’s profitability (in percentage terms) for every dollar of shareholders’ money they use in their businesses – when it comes to evaluating this particular financial metric, my preference is towards companies that are able to maintain it at 15.0% and above.
With that, let us take a look at Sheng Siong’s RoE recorded over a 10-year period which I’ve computed:
| FY2012 | FY2013 | FY2014 | FY2015 | |
| Return on Equity (%) | 27.5% | 26.0% | 20.1% | 23.3% |
| FY2016 | FY2017 | FY2018 | FY2019 | |
| Return on Equity (%) | 24.9% | 25.8% | 24.4% | 24.2% |
| FY2020 | FY2021 | |||
| Return on Equity (%) | 37.2% | 32.1% |
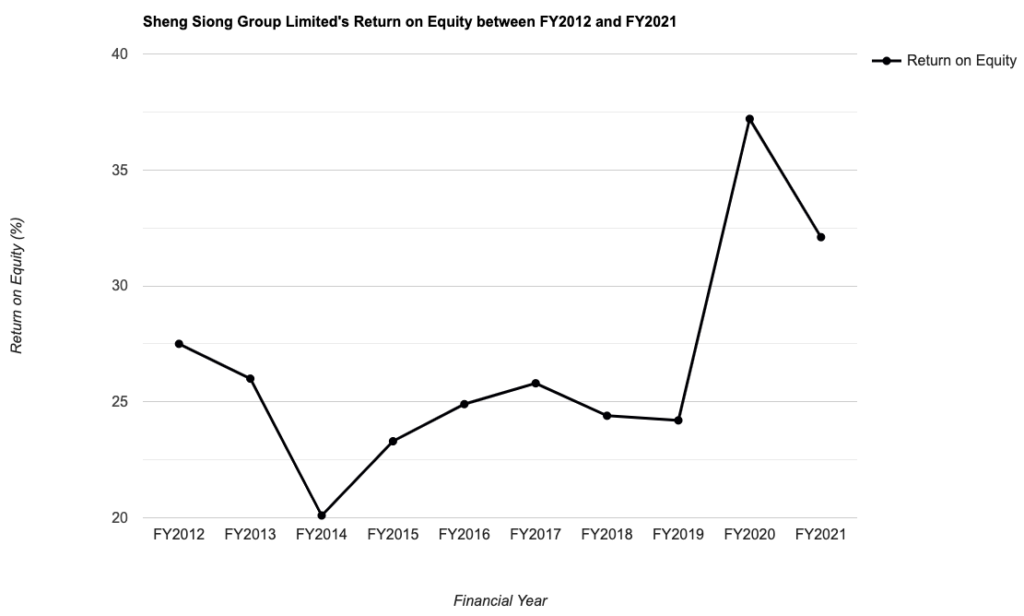
While its RoE have fluctuated over the years, but it fulfils my requirement of maintaining at way above 15.0% throughout the 10 years I have looked at. Also, its RoE have also been on an upward moving trend over the years (if you look at the chart above) – which is something I find desirable as well.
Debt Profile (FY2012 to FY2021)
When it comes to shortlisting a company to add to my long-term investment portfolio, one of my criteria is that the company should preferably have little or no borrowings, and at the same time maintaining a net cash position.
The following is Sheng Siong’s debt profile which I have compiled over the past 10 years – between FY2012 and FY2021:
| FY2012 | FY2013 | FY2014 | FY2015 | |
| Cash & Cash Equivalents (S$’mil) | $120.4m | $99.7m | $130.5m | $125.9m |
| Total Borrowings (S$’mil) | – | – | – | – |
| Net Cash/ Debt (S$’mil) | +$120.4m | +$99.7m | +$130.5m | +$125.9m |
| FY2016 | FY2017 | FY2018 | FY2019 | |
| Cash & Cash Equivalents (S$’mil) | $63.5m | $73.4m | $87.2m | $76.4m |
| Total Borrowings (S$’mil) | – | – | – | – |
| Net Cash/ Debt (S$’mil) | +$63.5m | +$73.4m | +$87.2m | +$76.4m |
| FY2020 | FY2021 | |||
| Cash & Cash Equivalents (S$’mil) | $253.9m | $246.6m | ||
| Total Borrowings (S$’mil) | $30.0m | $5.0m | ||
| Net Cash/ Debt (S$’mil) | +$223.9m | +$241.6m |
Sheng Siong has minimal debt (which is a plus point), and at the same time, its net cash position have strengthened significantly over the years.
Dividend Payout (FY2012 to FY2021)
The management of Sheng Siong Group Limited declares a dividend payout to its shareholders on a half-yearly basis – once when it releases its second quarter results, and once when it releases its fourth quarter (and full year) results.
The following table is the supermarket chain’s dividend payout to its shareholders over the last 10 financial years (between FY2012 and FY2021), along with its payout ratios:
| FY2012 | FY2013 | FY2014 | FY2015 | |
| Dividend Per Share (S$’cents) | 2.75 cents | 2.60 cents | 3.00 cents | 3.50 cents |
| Dividend Payout Ratio (%) | 91.4% | 92.5% | 89.8% | 92.6% |
| FY2016 | FY2017 | FY2018 | FY2019 | |
| Dividend Per Share (S$’cents) | 3.75 cents | 3.30 cents | 3.40 cents | 3.55 cents |
| Dividend Payout Ratio (%) | 89.9% | 71.1% | 72.3% | 70.4% |
| FY2020 | FY2021 | |||
| Dividend Per Share (S$’cents) | 6.50 cents | 6.20 cents | ||
| Dividend Payout Ratio (%) | 70.5% | 70.2% |
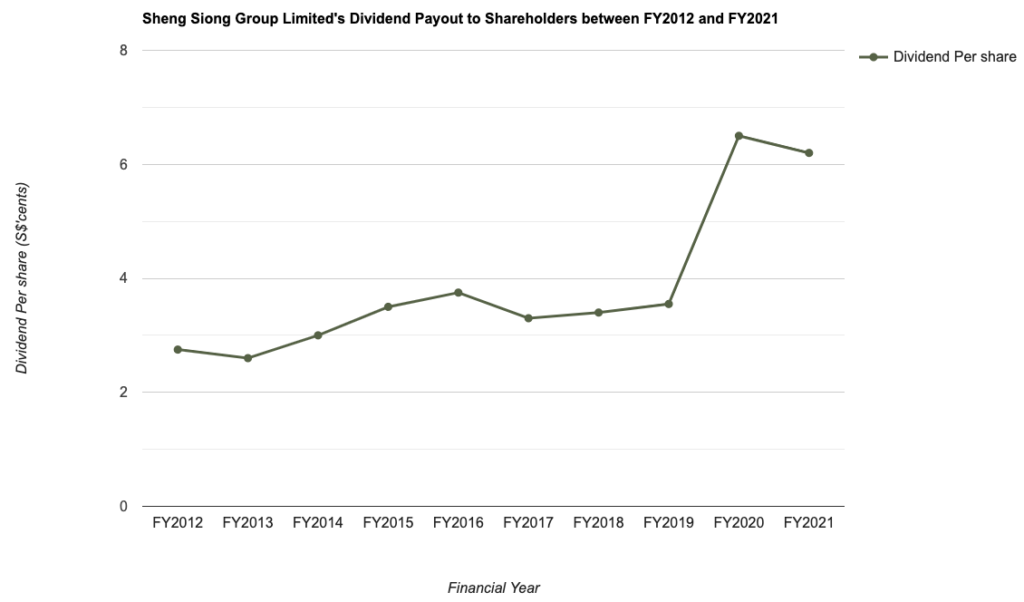
Looking at its dividend payout ratios over the years, it seems like the company distributes a huge majority of its earnings to its shareholders as dividends (and as such, should the company’s earnings were to decline, then its dividend payouts to shareholders is very likely to be impacted.)
In terms of its payout, it has improved in 7 out of 10 years – and growing at a CAGR of 8%.
Closing Thoughts
A strong set of financial results recorded over the years, along with the company having minimal borrowings and maintaining a net cash position in all of the 10 years I have looked at, plus a strong CAGR in its dividend payouts to shareholders are reasons why the company one that I still fancy.
Looking ahead, I’m of the opinion that as Singapore progressively reopens in the coming months ahead (assuming there are no other Covid-19 variants which will disrupt the country’s reopening plans), its financial performance over the 1-2 years will continue to weaken (compared to FY2020 and FY2021) as lives goes back to normal, and demand for the supermarket chain’s groceries will go back to pre-pandemic levels – unless or otherwise the company opens new stores (in Singapore and in China) to support the potential loss in revenue caused by the elevated demand in FY2020.
Another thing to note is that, along with a potential weakness in the company’s results, its dividend payouts should further come down (as you have seen in the previous section on dividend payouts, where the company distributes a huge chunk of its earnings to shareholders as dividends), and its share price will likely weaken as well – as such, I will continue to monitor its share price movements and will look at investing in the company down the road when the share price drop stabilises (looking how its share price have trended since August 2020, it has been on a downward moving trend.)
With that, I have come to the end of my update on Sheng Siong’s financial performance, debt profile, and dividend payouts over a 10-year period, along with my outlook for the company over the next 1-2 years ahead. As always, everything that you’ve just read above are purely my own, which I’m sharing for informational purposes only. They do not imply any buy or sell calls for the company’s shares. Please do your own due diligence before you make any investment decisions.
Disclaimer: At the time of writing, I am not a shareholder of Sheng Siong Group Limited.
More articles on THE SINGAPOREAN INVESTOR
DBS vs. UOB vs. OCBC: Who Came Out on Top in its Q2 and 1H FY2024 Results?
Created by ljunyuan | Aug 12, 2024
Discussions
Be the first to like this. Showing 0 of 0 comments
Post a Comment
Featured Posts


Latest Videos


Apps


Top Articles
1
RHB Investment Research Reports
ComfortDelGro - Higher Public Transport Fares in Singapore; BUY
2
CEO Morning Brief
Pope Francis, in Singapore, Urges Fair Wages for Migrant Workers
3
reitsnewsletter
4
RHB Investment Research Reports
Pan-United Corp - Beneficiary of Singapore Construction Projects
5
SGX Market Updates
STI Return Above 3,400 Sees Stocks Draw S$760M Net Institutional Inflow
#
Stock
Score
Daily Stocks
Stock Name
Last
Change
Volume
Stock Name
Last
Change
Volume
Stock Name
Last
Change
Volume
Featured Advertisers / Partners


Ride The Bull Short The Bear
CS Tan
4.9 / 5.0
This book is the result of the author's many years of experience and observation throughout his 26 years in the stockbroking industry. It was written for general public to learn to invest based on facts and not on fantasies or hearsay....