


THE SINGAPOREAN INVESTOR
How Do I Execute a Long Swing Trade in the US Market

ljunyuan
Publish date: Mon, 07 Mar 2022, 02:32 PM
ljunyuan
0 356
My name is Jun Yuan, and I am the owner of The Singaporean Investor. I am a full-time retail investor and trader since April 2017, and in this website, I'd be sharing with you my personal analyses of Singapore-listed companies, along with advices relating to investing, as well as trading. You can find out more about me here, and check out my long-term portfolio here.

Some time last month (February 2022), I had the honour of being interviewed by the Chief Operating Officer of InvestingNote Mr Ethan Ho, where I shared about what I do on a daily basis as a full-time retail investor cum trader, metrics I look at when it comes to selecting a REIT to add to my long-term investment portfolio, and also my thoughts about inflation in general – for those of you who have missed the interview, you can watch the replay here.
One of the questions raised after the session was pertaining to my strategy on doing a long swing trade on the US market. I thought it was a really interesting question and I’d like to dedicate today’s post to answer it (first and foremost, my sincere apologies for the late response as I was pre-occupied with other work.)
Let’s begin:
I make use of 3 technical analysis indicators for all of my trades, and they are:
- Moving Average – particularly, I look at the 20-day, 50-day, 100-day, 150-day, and 200-day moving averages on a weekly timeframe (why weekly timeframe because from experience, I find them to be better in identifying key support and/or resistance levels that are much ‘respected’ compared to using moving averages on a daily timeframe; in terms of the time periods, these 5 time periods are most commonly used by traders, the provide a much more accurate analysis on how a company’s share prices may move)
- Moving Average Convergence Divergence (MACD) on a daily timeframe (if the blue line is below the red line, it is a downtrend, and vice versa)
- Stochastic on a daily timeframe (if the blue line is above the red line, it signifies an uptrend, and vice versa)
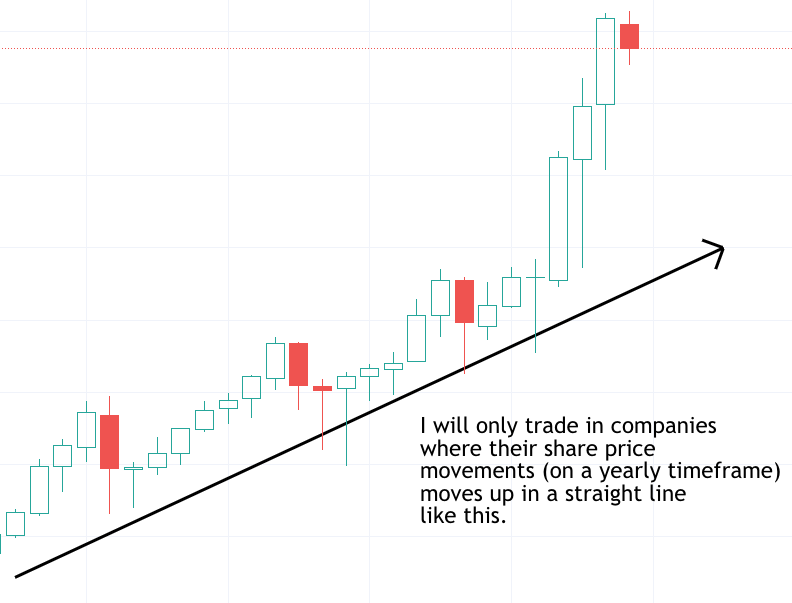
Also, I will only trade companies where their price movements moves in an upward trend on a yearly timeframe, something like The Proctor & Gamble Company’s (NYSE:PG) in the screenshot below:
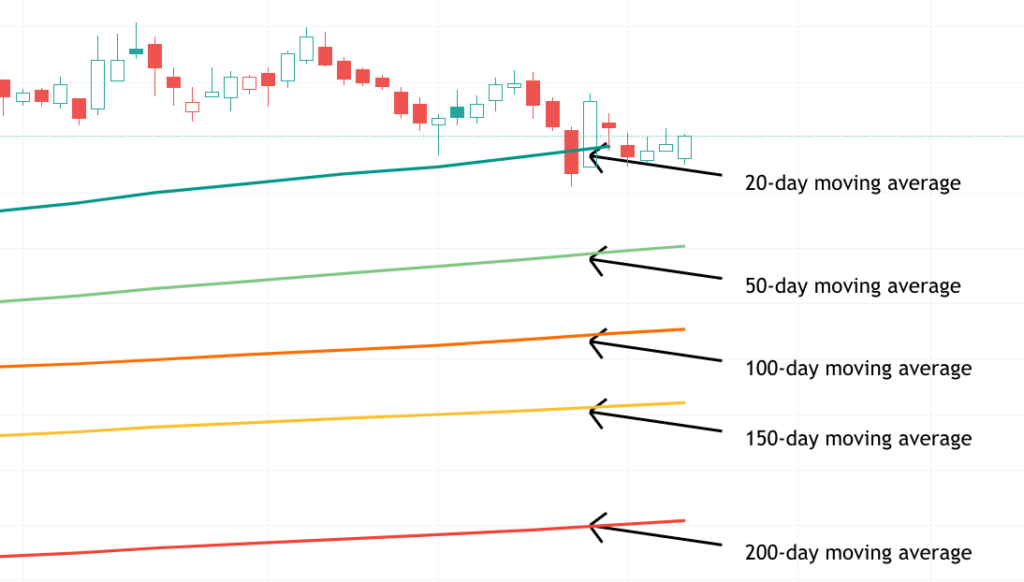
Next, I will look at the company’s share price movement on a daily timeframe to make sure that their weekly moving averages (if you are using TradingView, you can set the ‘Indicator Timeframe’ to ‘1 week’ for the moving averages to be on a weekly timeframe) are in the following order – the 20-day moving average above the 50-day moving average, the 50-day moving average above the 100-day moving average, the 100-day moving average above the 150-day moving average, and the 150-day moving average above the 200-day moving average as follows (P&G’s moving averages satisfies this requirement of mine) – in case you’re wondering why the moving averages have to be in that order, that’s because if the moving averages on a chart are in that order, it signifies the company’s share price is still on an upward moving trend – meaning its upward movement is much stronger than its downward movement:
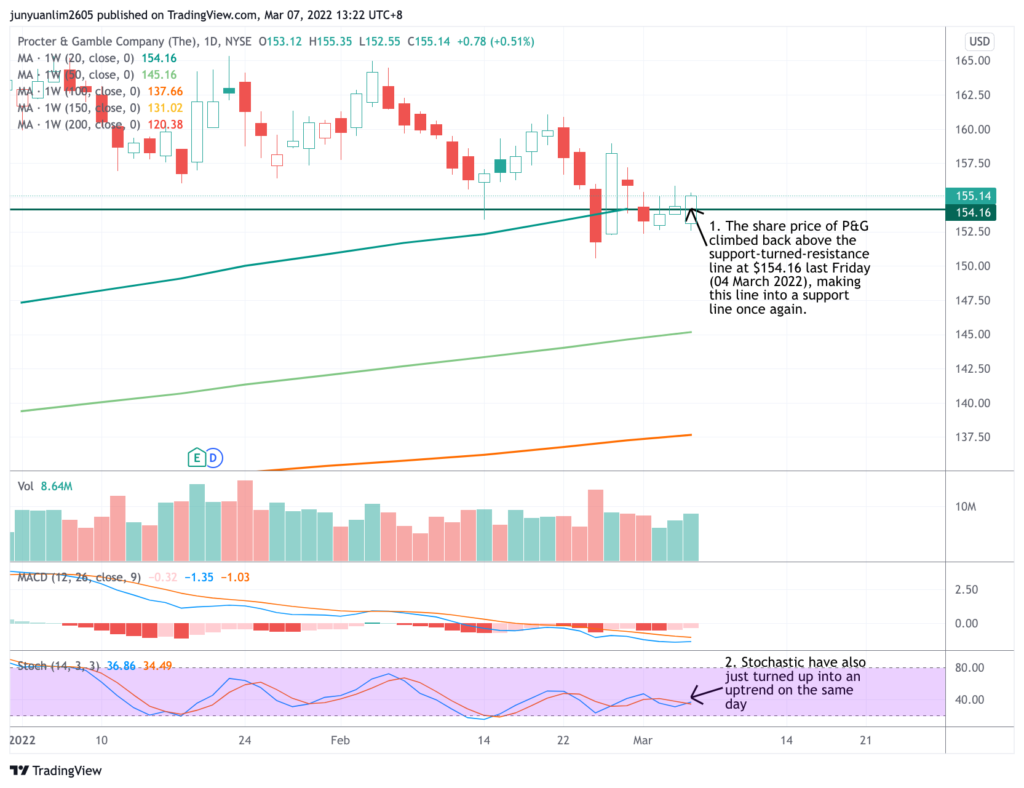
Personally, when it comes to entering a trade, I will always wait for the company’s share price to come to to where the moving averages are, and showing signs of a bounce back up (such as a bullish green candlestick appearing on a high volume, or technical indicators MACD and/or stochastic reversing into an uptrend position once again) – in P&G’s case, you can see that after falling slightly below the 20-day moving average, its share price last Friday has climbed back up again. Also, its stochastic has also just turned into an uptrend (where the blue line have just crossed above the red line), suggesting that it could go up from here:
At this point, there are two things I could possibly do:
1. Execute my ‘long’ trade, with my entry price at $154.16, where the 20-day moving average is the following day (I never get into any trades in the middle of the day – I will wait till the trading day is over before I try to identify any good trading setups and execute them the following day);
2. Wait for confirmation the next trading day to make sure it stays above this 20-day moving average line before I make any moves (by waiting for a confirmation, it could further improve my chance of making a profit from this trade; but on the other hand, I may risk missing out as the share price could jump up further the following day)
Let’s say I decide to enter at $154.16, at what price point do I look at exiting my trade, as well as stop out?
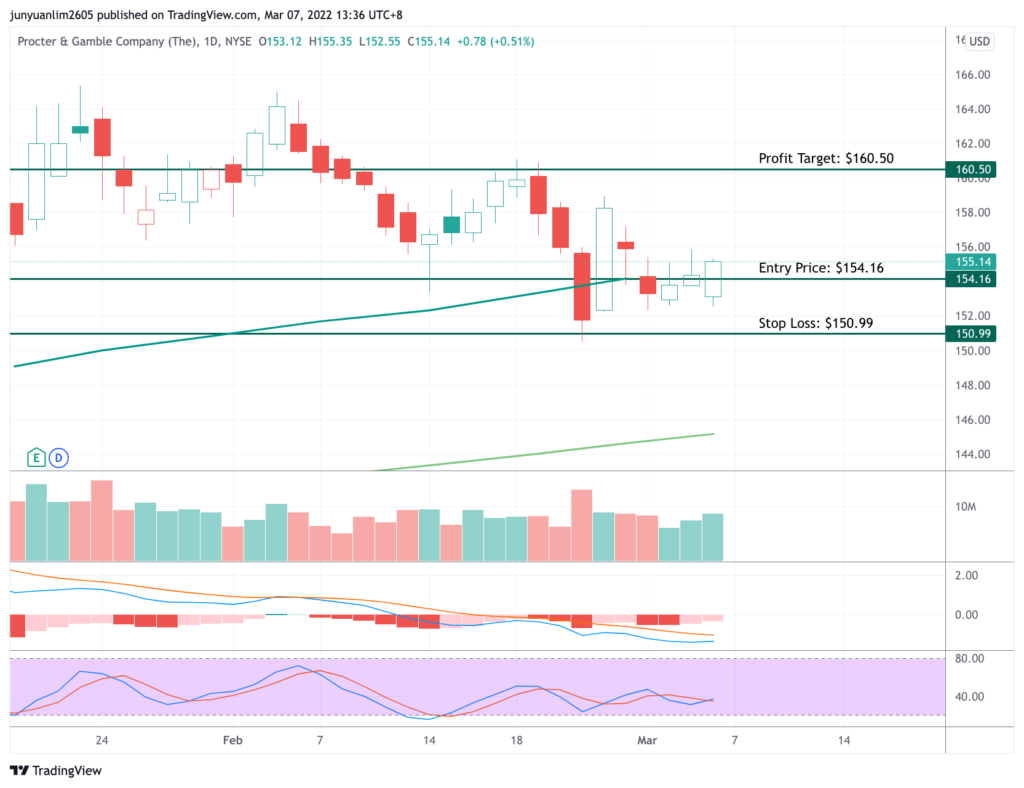
Again, let us take a look at the chart below, where I pointed out where the share price could head towards before rebounding down – which is somewhere around the $160.50 level:

At this price point, I will generate a profit of around 4.1% (buying at $154.16 and exiting at $160.50 – a price difference of $6.34.) For stop-loss, I will set it at half of the profit amount (i.e. $6.34 divided by 2 = $3.17). As such, my stop loss will be at $150.99, or a loss of 2.1% (my entry price of $154.16 minus $3.17.)
My entire trading setup will be as follows:
That said, I personally will NOT enter trades into a company that is due to release its quarterly results in the next 2 weeks – simply because depending on its results (whether it is favourable or unfavourable), its share price may swing aggressively from one direction to the next, rendering the technical analysis invalid.
Also, I will be very mindful of the current environment before I execute any trades – at the time of writing this post, the broad market has been swinging very wildly due to Russia’s invasion of Ukraine. So personally, even if the technical analysis may point towards an opportunity to go ‘long’, but any negative swings in the broad market may cause share prices of the companies to come down as well – after all, as the word ‘technical analysis’ implies, it’s just an ‘analysis’ – nothing’s for sure, that is why it is important to have a stop-loss target in place so that we can keep our losses to the minimum (if the share price does not move in the direction we want it to.)
Another thing to note is that, the above is my personal strategy for executing ‘long’ swing trades in the US market just to share – since I’m asked about it. There are numerous ways to execute ‘long’ swing trades, so there’s no hard or fuss rule here – most importantly, you need to be comfortable with it.
With that, I have come to the end of my share today. Hope you’ve found the contents above useful, and here’s wishing you a great week ahead! If you have any questions regarding my video interview, do feel free to let me know, either in the ‘comments’ box in this post, in InvestingNote, or you can also send me an email with your questions here.
Disclaimer: At the time of writing, I do not have any trades in The Proctor & Gamble Company.
More articles on THE SINGAPOREAN INVESTOR
DBS vs. UOB vs. OCBC: Who Came Out on Top in its Q2 and 1H FY2024 Results?
Created by ljunyuan | Aug 12, 2024
Discussions
Be the first to like this. Showing 0 of 0 comments
Post a Comment
Featured Posts
New Update. Discover investment communities that resonate with your ideas
Trade Confidently & Analyze Charts Conveniently - Download VCPlus IOS & Android App Now!
Latest Videos


Apps


Top Articles
1
RHB Investment Research Reports
ComfortDelGro - Higher Public Transport Fares in Singapore; BUY
2
CEO Morning Brief
Pope Francis, in Singapore, Urges Fair Wages for Migrant Workers
3
reitsnewsletter
4
RHB Investment Research Reports
Pan-United Corp - Beneficiary of Singapore Construction Projects
5
SGX Market Updates
STI Return Above 3,400 Sees Stocks Draw S$760M Net Institutional Inflow
#
Stock
Score
Daily Stocks
Stock Name
Last
Change
Volume
Stock Name
Last
Change
Volume
Stock Name
Last
Change
Volume
Featured Advertisers / Partners


Ride The Bull Short The Bear
CS Tan
4.9 / 5.0
This book is the result of the author's many years of experience and observation throughout his 26 years in the stockbroking industry. It was written for general public to learn to invest based on facts and not on fantasies or hearsay....