


THE SINGAPOREAN INVESTOR
Why is Parkway Life REIT in My 'Shopping List'

ljunyuan
Publish date: Tue, 01 Mar 2022, 01:52 PM
ljunyuan
0 356
My name is Jun Yuan, and I am the owner of The Singaporean Investor. I am a full-time retail investor and trader since April 2017, and in this website, I'd be sharing with you my personal analyses of Singapore-listed companies, along with advices relating to investing, as well as trading. You can find out more about me here, and check out my long-term portfolio here.

Yesterday, I shared on the InvestingNote platform on how, as a retail investor, I intend to navigate through the current market volatility (brought upon by Russia’s recent invasion of Ukraine) as far as building my portfolio is concerned – you can read all about it here.
One of the things I’ve mentioned is that I intend to add 2 companies into my portfolio should my preferred price comes – one of them is Parkway Life REIT (SGX:C2PU) – I’ve also previously written about the REIT back in September 2020 (you can find the post here.)
Today, I’d like to provide some update on the REIT – because since my last post about it, 2 full-year results have been posted. Also, in that post, I’ve only looked at the REIT’s results over a 5-year period (between FY2015 and FY2019.)
In this post, you’ll find my review of the healthcare REIT over a 10-year period (between FY2012 and FY2021) in terms of its financial performance, portfolio occupancy and debt profile, as well as its distribution payout to its unitholders.
Let’s begin…
A Quick Introduction about Parkway Life REIT
First, a quick introduction about Parkway Life REIT, for those who are unfamiliar with it – it is one of Asia’a largest-listed healthcare REITs, where its portfolio currently consists of 56 properties in Singapore (Mount Elizabeth Hospital, Gleneagles Hospital, and Parkway East Hospital), Japan (where it has 52 high-quality nursing home and care facility properties in the various prefectures in the country), as well as in Malaysia (MOB Specialist Clinics in Kuala Lumpur.)
Financial Performance
The following table and chart is the healthcare REIT’s financial performance over a 10-year period – between FY2012 and FY2021:
| FY2012 | FY2013 | FY2014 | FY2015 | |
| Gross Revenue (S$’mil) | $94.1m | $93.7m | $100.4m | $102.7m |
| Net Property Income (S$’mil) | $87.6m | $87.6m | $93.8m | $96.0m |
| Distributable Income to Unitholders (S$’mil) | $62.4m | $65.1m | $69.7m | $80.4m |
| FY2016 | FY2017 | FY2018 | FY2019 | |
| Gross Revenue (S$’mil) | $110.1m | $109.9m | $112.8m | $115.2m |
| Net Property Income (S$’mil) | $102.4m | $102.6m | $105.4m | $108.2m |
| Distributable Income to Unitholders (S$’mil) | $73.3m | $80.8m | $77.9m | $79.8m |
| FY2020 | FY2021 | |||
| Gross Revenue (S$’mil) | $120.9m | $120.7m | ||
| Net Property Income (S$’mil) | $112.5m | $111.2m | ||
| Distributable Income to Unitholders (S$’mil) | $83.4m | $85.2m |
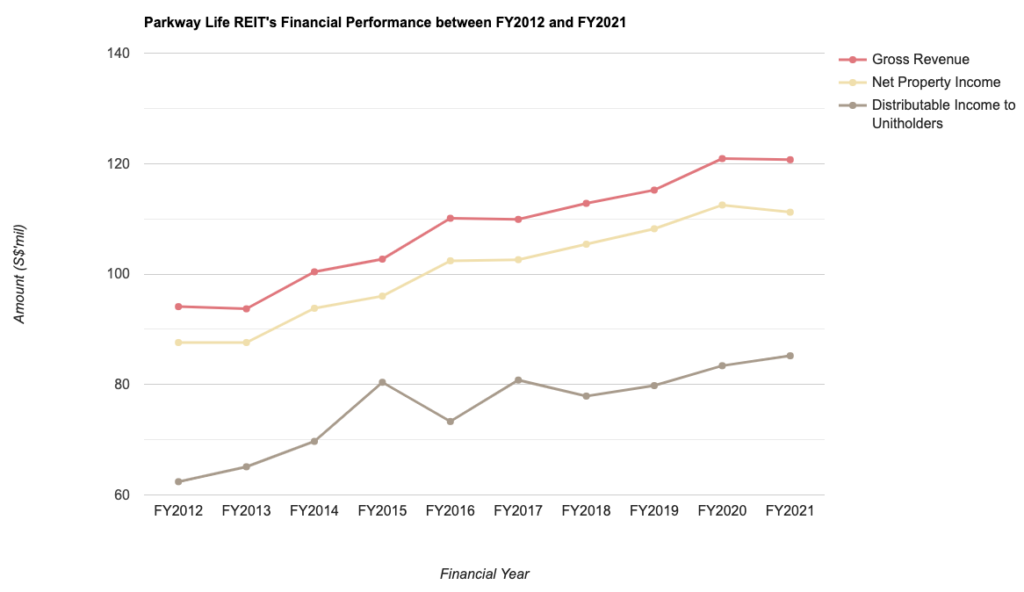
As far as the REIT’s key financial performances are concerned, you can see from the chart above that is has trended up over the years (albeit with some slight dips along the way) – over a 10 year period, its gross revenue edged down slightly in 3 years (in FY2013, FY2017 – due to depreciation of the Japanese Yen, as well as in FY2021 – due to the divestment of P-Life Matsudo Property in January 2021, along with the depreciation of Japanese Yen), its net property income edged down in just one out of the 10 years I have looked at, and its distributable income to unitholders was down in 2 years (in FY2016, due to the exclusion of distribution of gains arising from the divestment of 7 Japan properties in December 2014, which have been fully distributed to unitholders over 4 quarters in FY2015, as well as in FY2018, again due to the absence of a one-off distribution of a divestment gain of 4 Japan properties in December 2016, which have been fully distributed to unitholders over 4 quarters in FY2017.)
Growth-wise, its gross revenue, net property income, and distributable income to unitholders saw compound annual growth rates (CAGR) of 3%, 2%, and 3% respectively – which is stable in my opinion, and exactly what I’m looking for when it comes to adding companies to my long-term investment portfolio.
Portfolio Occupancy
When it comes to investing in REITs, my preference is towards those that is able to maintain an occupancy rate of 90.0% and above over the years (and at the same time, not displaying any declines as far as its occupancy rates over the years is concerned.)
So, did Parkway Life REIT’s portfolio occupancy profile fulfil my requirement? Let us find out in the table and chart below:
| FY2012 | FY2013 | FY2014 | FY2015 | |
| Portfolio Occupancy (%) | 100.0% | 100.0% | 100.0% | 100.0% |
| Portfolio WALE (by Gross Rental Income – Years) | 14.3 years | 14.2 years | 9.4 years | 9.1 years |
| FY2016 | FY2017 | FY2018 | FY2019 | |
| Portfolio Occupancy (%) | 100.0% | 100.0% | 100.0% | 99.7% |
| Portfolio WALE (by Gross Rental Income – Years) | 8.4 years | 7.9 years | 7.1 years | 6.5 years |
| FY2020 | FY2021 | |||
| Portfolio Occupancy (%) | 99.7% | 99.7% | ||
| Portfolio WALE (by Gross Rental Income – Years) | 5.7 years | 17.3 years |
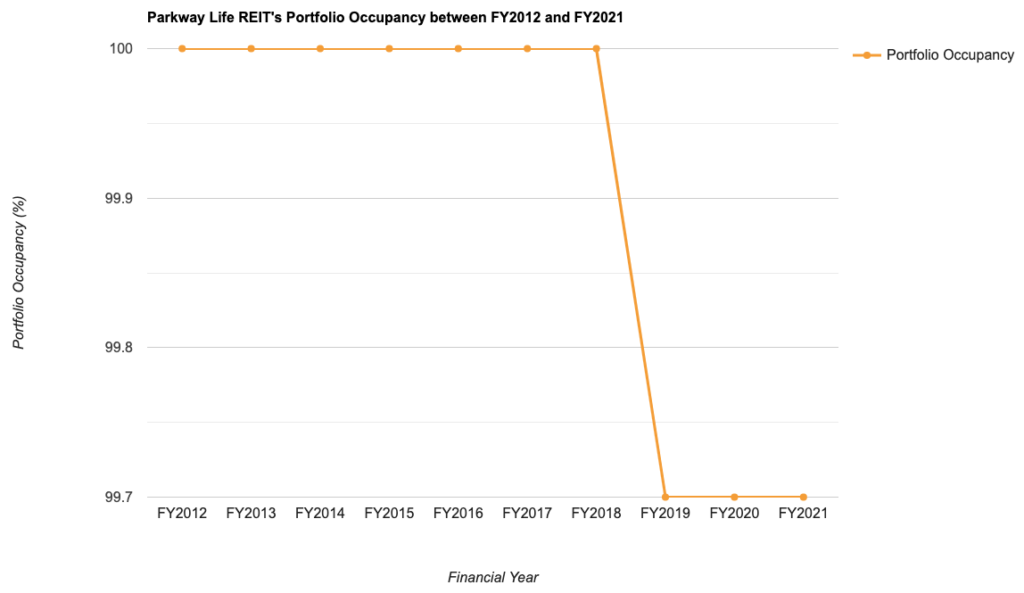
Personally, I’m happy to note that, over a 10-year period, Parkway Life REIT has maintained its occupancy at a high percentage – where apart from the 3 most recent years, its properties are 100.0% occupied.
For its portfolio WALE (Weighted Average Lease Expiry), it has been on a downward moving trend over the years, before a proposed transaction announced July 2021 (with a new master lease agreement for the 3 Singapore hospitals) saw it drastically improved to 17.3 years – you can read the press release about it here. Another thing to note that the REIT’s current portfolio WALE, at 17.3 years, is the highest among the Singapore-listed REITs (as far as I am aware.)
Debt Profile
When it comes to reviewing a REIT’s debt profile – my criteria for selection includes the REIT having a good debt headroom (of about 10.0%) before the regulatory limit (of 50.0%) is reached. Also, my preference is towards REITs that are able to consistently maintain their interest coverage ratio (a metric which measures the REIT’s ability to service its interest payments) at 5.0x or higher.
The following table is Parkway Life REIT’s debt profile over a 10-year period – between FY2012 and FY2021:
| FY2012 | FY2013 | FY2014 | FY2015 | |
| Aggregate Leverage (%) | 32.9% | 33.0% | 35.2% | 35.3% |
| Interest Coverage Ratio (times) | 8.8x | 9.5x | 10.1x | 9.8x |
| Average Term to Debt Maturity (years) | 2.5 years | 3.2 years | 3.7 years | 3.5 years |
| Average Cost of Debt (%) | 1.6% | 1.6% | 1.4% | 1.6% |
| FY2016 | FY2017 | FY2018 | FY2019 | |
| Aggregate Leverage (%) | 36.3% | 36.4% | 36.1% | 37.1% |
| Interest Coverage Ratio (times) | 8.7x | 11.3x | 13.7x | 14.1x |
| Average Term to Debt Maturity (years) | 3.6 years | 3.1 years | 2.9 years | 2.8 years |
| Average Cost of Debt (%) | 1.4% | 1.0% | 1.0% | 0.8% |
| FY2020 | FY2021 | |||
| Aggregate Leverage (%) | 38.5% | 35.4% | ||
| Interest Coverage Ratio (times) | 18.1x | 21.5x | ||
| Average Term to Debt Maturity (years) | 3.5 years | 3.4 years | ||
| Average Cost of Debt (%) | 0.5% | 0.5% |

No doubt the REIT’s aggregate leverage have climbed gradually over the years (between FY2012 and FY2020), but they still have a debt headroom of about 10.0% before the regulatory limit of 45.0% then – which satisfies my criteria for selection.
Another thing to note is that its interest coverage ratio is the highest among the Singapore-listed REITs, contributed by its declining average cost of debt over the same time period (which is also one of the lowest among the Singapore-listed REITs.)
Distribution Payout to Unitholders
Parkway Life REIT used to be paying out a distribution to its unitholders on a quarterly basis. However, from FY2022 onwards, they will be switching to a half-yearly payout – meaning the REIT will only declare a distribution to its unitholders when it reports its results for the first half (for the period between January and June), as well as for the second half (for the period between July and December) of the financial year.
The following table is the healthcare REIT’s distribution payout to its unitholders between FY2012 and FY2021:
| FY2012 | FY2013 | FY2014 | FY2015 | |
| Distribution Per Unit (S$’cents) | 10.31 cents | 10.75 cents | 11.52 cents | 13.29 cents |
| FY2016 | FY2017 | FY2018 | FY2019 | |
| Distribution Per Unit (S$’cents) | 12.12 cents | 13.35 cents | 12.87 cents | 13.19 cents |
| FY2020 | FY2021 | |||
| Distribution Per Unit (S$’cents) | 13.79 cents | 14.08 cents |
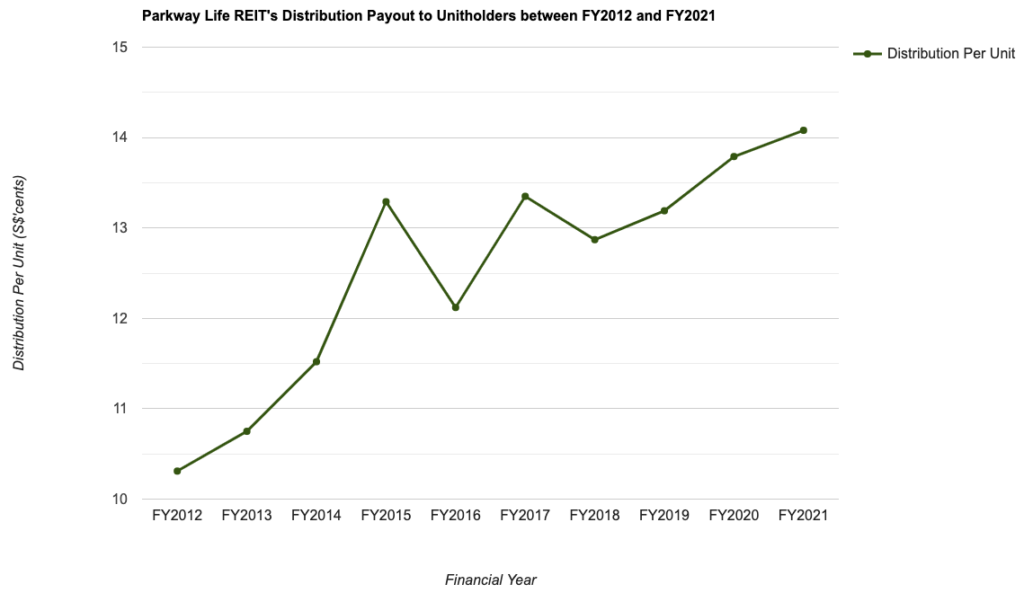
Over a 10-year period, the REIT’s distribution saw slight decline in just 2 years (FY2016 and FY2018, due to a lack of one-off divestment gains in the immediate year before), and recording a CAGR of 3% – in-line with its growth in its financial results over the years (which I have looked at earlier in this post), and in my opinion, considered pretty stable.
Closing Thoughts
In my personal opinion, the healthcare REIT ticks all the boxes – a stable financial performance over the years (the same can also be said for its distribution payouts to unitholders), a resilient portfolio occupancy profile (where its properties are very close to being fully occupied, or fully occupied throughout the past 10 years I have looked at), and also a very healthy debt profile (in fact, as I’ve mentioned earlier, the REIT’s debt profile is one of the best, if not the best, among all the Singapore-listed REITs.)
However, there’s one thing you’d need to know – with effect from FY2022, the REIT will only be reporting its full financial results on a half-yearly basis, and also declare a distribution payout to its unitholders in the same time frequency – so for those of you who are looking for a REIT that pays out a distribution on a quarterly basis, then you need to know that it no longer will be doing so.
Finally, as to how much I’m looking to invest in the REIT (for those of you who are interested to know) – I’m looking to invest in it at $3.50, where, based on its full-year distribution payout of 14.08 cents/unit in FY2021, it represented a distribution yield of 4.0% – which is my minimum for selection.
With that, I have come to the end of my post on Parkway Life REIT’s 10-year result review, along with highlighting reasons why the healthcare REIT is in my ‘shopping list’. As usual, I hope you’ve found the contents presented above insightful, and that do take note that everything you’ve just read above is purely for educational purposes only, and they do not represent any buy or sell calls for the REIT’s units. You should always do your own due diligence before you make any investment decisions.
Disclaimer: At the time of writing, I am not a unitholder of Parkway Life REIT.
More articles on THE SINGAPOREAN INVESTOR
DBS vs. UOB vs. OCBC: Who Came Out on Top in its Q2 and 1H FY2024 Results?
Created by ljunyuan | Aug 12, 2024
Discussions
Be the first to like this. Showing 0 of 0 comments
Post a Comment
Featured Posts
New Update. Discover investment communities that resonate with your ideas
Trade Confidently & Analyze Charts Conveniently - Download VCPlus IOS & Android App Now!
Latest Videos


Apps


Top Articles
1
RHB Investment Research Reports
ComfortDelGro - Higher Public Transport Fares in Singapore; BUY
2
CEO Morning Brief
Pope Francis, in Singapore, Urges Fair Wages for Migrant Workers
3
reitsnewsletter
4
RHB Investment Research Reports
Pan-United Corp - Beneficiary of Singapore Construction Projects
5
SGX Market Updates
STI Return Above 3,400 Sees Stocks Draw S$760M Net Institutional Inflow
#
Stock
Score
Daily Stocks
Stock Name
Last
Change
Volume
Stock Name
Last
Change
Volume
Stock Name
Last
Change
Volume
Featured Advertisers / Partners


Ride The Bull Short The Bear
CS Tan
4.9 / 5.0
This book is the result of the author's many years of experience and observation throughout his 26 years in the stockbroking industry. It was written for general public to learn to invest based on facts and not on fantasies or hearsay....