


Trader Hub
Oversea-Chinese Banking Corp Ltd – Fee Income Recovers While NII Continues to Surge

traderhub8
Publish date: Fri, 12 May 2023, 09:58 AM
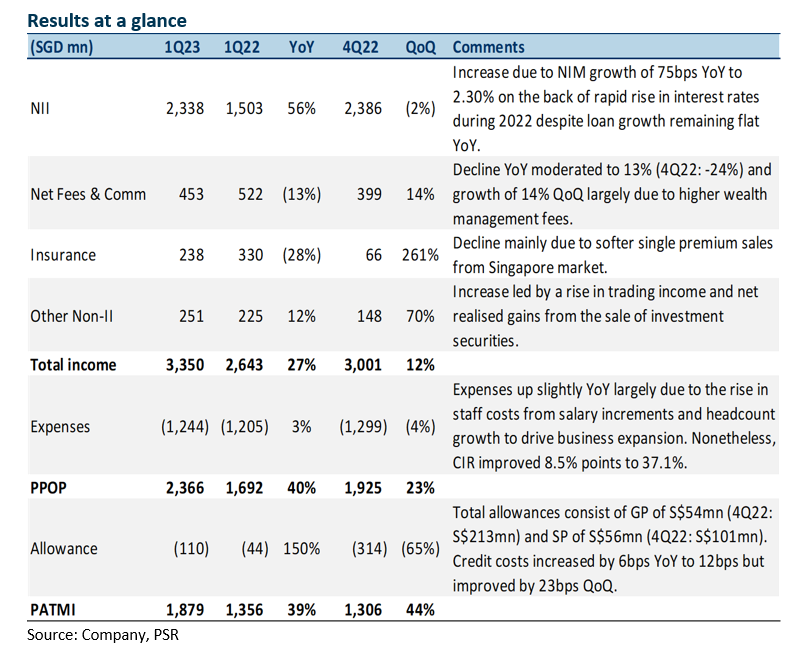
- 1Q23 earnings of S$1.88bn were slightly above our estimates. It came from higher net interest income and a reversal of fee income decline offset by lower insurance income. 1Q23 PATMI was 28% of our FY23e forecast.
- NII grew 56% YoY as NIM surged 75bps YoY to 2.30% and loan growth remained flat YoY. Total non-interest income dipped 11% YoY from lower fees and insurance, but fee income momentum was building up with a 65% QoQ rise. Allowance remained subdued with credit costs at 12bps.
- Maintain BUY with an unchanged target price of S$14.96. We maintain FY23e earnings as we increase NII estimates for FY23e due to higher NIMs, offset by lower other non-interest income and higher allowance estimates. We assume 1.29x FY22e P/BV and ROE estimate of 10.8% in our GGM valuation. Catalysts include continued interest income growth and fee income recovery as economic conditions improve. OCBC is our preferred pick among the three banks due to attractive valuations and dividend yield of 6.5%, buffered by a well-capitalised 15.9% CET 1, and fee income recovery from China’s re-opening.
The Positives
– Fee income YoY decline moderated, up 14% QoQ. Fee income YoY decline of 14% moderated from the previous quarter (4Q22: -24%) and dipped to S$453mn mainly due to a drop in wealth management fees as customer activities were subdued amid risk-off investment sentiments globally. Nonetheless, it saw its first QoQ increase in 6 quarters, growing 14% QoQ mainly driven by higher wealth management fees. The Group’s wealth management income was S$1.10 billion, 33% higher QoQ, and contributed 33% to the Group’s total income. OCBC’s wealth management AUM was higher at S$270bn (1Q22: S$251bn) mainly driven by sustained growth in net new money inflows and positive market valuation.
+ Net interest income surged 56% YoY. NII grew 56% YoY led by NIM improvement of 75bps YoY to 2.30% despite loan growth remaining flat YoY. NIM expansion was mainly due to loan yields rising faster than the increase in funding costs on the back of the rapid rise in interest rates during the year. However, both NII and NIM declined QoQ, the first decline in 6 quarters. This was mainly due to a rise in asset yields being offset by higher funding costs, as well as lower loans-to-deposits ratio as the increase in deposits outpaced that of loans. Nonetheless, OCBC has increased their NIM guidance for FY23e from 2.10% to 2.20%.
+ Trading income up 12% YoY. Trading income grew 12% YoY and 69% QoQ. YoY growth was largely driven by higher non-customer flow income as customer flow income remained flat. QoQ growth was driven by both higher customer and non-customer flow income, as well as higher net realised gains from the sale of investment securities of S$24mn (4Q22: loss of S$67mn).
The Negatives
– Allowances up 151% YoY, credit costs at 12bps. Total allowances fell 65% QoQ but were up 151% YoY to S$110mn. GPs of S$54mn (4Q22: S$213mn) and SPs of S$56mn (4Q22: S$101mn) were made during the quarter. The YoY increase was mainly due to higher allowances set aside for non-impaired assets. Total NPAs were down 5% QoQ and 23% YoY to S$3.33bn, and the NPL ratio improved by 30bps YoY to 1.1%. Credit costs increased by 6bps YoY but improved by 23bps QoQ to 12bps.
– CASA ratio continues to dip. Current Account Savings Accounts (CASA) ratio fell 15.6% points YoY to 47.1% due to the high interest rate environment and a move towards fixed deposits (FD). Nonetheless, total customer deposits increased 5% YoY to S$367bn underpinned by strong growth in FDs. The Group’s funding composition remained stable with customer deposits comprising more than 80% of total funding.
Source: Phillip Capital Research - 12 May 2023
Related Stocks
| Chart | Stock Name | Last | Change | Volume |
|---|
Market Buzz
More articles on Trader Hub
CSOP IEdge S-REIT Leaders Index ETF – The Deeper Discounted Singapore REIT ETF
Created by traderhub8 | Jun 12, 2024
Valuetronics Holdings Ltd- Get Paid as Customer Base Is Refreshed
Created by traderhub8 | Jun 03, 2024
Discussions
Be the first to like this. Showing 0 of 0 comments
Post a Comment
Featured Posts
New Update. Discover investment communities that resonate with your ideas
Trade Confidently & Analyze Charts Conveniently - Download VCPlus IOS & Android App Now!
Latest Videos


Apps


Top Articles
1
THE SINGAPOREAN INVESTOR
Investing in Singapore's Hospitality Scene: A Look at the 5 Listed REITs
2
RHB Investment Research Reports
Food Empire - Expanding Ingredients Capability in Vietnam; BUY
3
RHB Investment Research Reports
ST Engineering - Rolling Forward Our Valuation; Reiterate BUY
4
CEO Morning Brief
Singapore Home Sales Set for Worst Year Since Financial Crisis
5
SGX Market Dialogues
Kopi-C With GuocoLand’s Group CEO: ‘We Have Twin Engines for Growth’
#
Stock
Score
Daily Stocks
Stock Name
Last
Change
Volume
Stock Name
Last
Change
Volume
Stock Name
Last
Change
Volume
Featured Advertisers / Partners


Ride The Bull Short The Bear
CS Tan
4.9 / 5.0
This book is the result of the author's many years of experience and observation throughout his 26 years in the stockbroking industry. It was written for general public to learn to invest based on facts and not on fantasies or hearsay....