


Trader Hub
Uni-Asia Group Ltd – a New and Higher Plateau

traderhub8
Publish date: Fri, 01 Jul 2022, 08:58 AM
- 1Q22 freight rates for Uni-Asia fleet of 10 Handysize dry bulk ships are up 84% YoY to around US$18.4k per day. FY22e PATMI is expected to jump 40% to US$25mn.
- We expect freight rates to remain elevated for the next two years. Supply is constrained by inefficiencies (port congestion and slower speeds), constrained shipyard capacity, and uncertainty on future fuel types due to IMO 2030.
- Initiate coverage on Uni-Asia Group with a BUY rating and a target price of S$1.26. Our target price is pegged to 3x P/E FY22e, in line with industry peers. We believe the tight supply of dry bulkers will keep freight rates elevated for longer. Orders for dry bulkers are at a record low, as a percentage of the order-book. We expect Uni-Asia to pay special dividends from their record earnings.
Company Background
Founded in March 1997, Uni-Asia’s origins were in structured finance and distressed asset investments. The company was listed on the SGX on 17 August 2007. In 2010, the company expanded into ship and property investments. The core businesses of the company are the chartering of bulk carriers, investment properties in Hong Kong and the management and sale of residential projects in Japan. All 10 Uni-Asia bulk carriers are Handysize type vessels.
Investment Merits
- Record earnings from surging charter rates. Uni-Asia Freight rates in FY21 were averaging US$13k per day. We expect this to jump to around US$18k per day. 1Q22 has seen an 84% spike in freight rates. With a fleet of 10 vessels – 9 of which are due for renewal this year – it can ride on the spike in freight rates. Fuel cost is borne by the shipping operator, and we expect vessel operating costs to rise around US$850 per day or 15% to US$6,000. The increase is due to higher crew costs.
- Supply conditions remain very tight. We believe the current freight rates can sustain for the next two years. The supply of vessels is at record lows of 6.6% of the total fleet. Furthermore, with 11% of the fleet more than 20 years, any new delivery of vessels is likely to replace older ships rather than result in a net expansion in fleet size. Handysize has an even older fleet at 15% above 20 years. The limited number of bulk carriers being ordered is due to uncertainty of the future fuel type for vessels and limited yard capacity due to a surge in container ship orders. Other drivers constraining effective supply are slow steaming of vessels due to high fuel costs and port congestion.
- Stronger balance sheet and higher dividends. With record earnings, we expect Uni-Asia to pay a special dividend of 4 cents, double the amount paid last year. Together with higher interim and final dividend, total dividends in FY22e are expected at 12 cents (FY21: 7 cents) or 11% dividend yield. The payout is around US$13mn, around a 50% payout ratio. Free-cash flow generated totalling US$68mn over the next two years will swing the company into the net cash position by FY23e. The company is trading at a 50% discount to book value.
Phillip Securities Research has received monetary compensation for the production of the report from the entity mentioned in the report.
Revenue
In FY21, 70% of Uni-Asia revenue was charter income. We expect it to jump to 90% in FY22e. The 2nd largest revenue contributor is the sale of properties at 13%. Fee income and investment returns contribute 8% of revenue each.
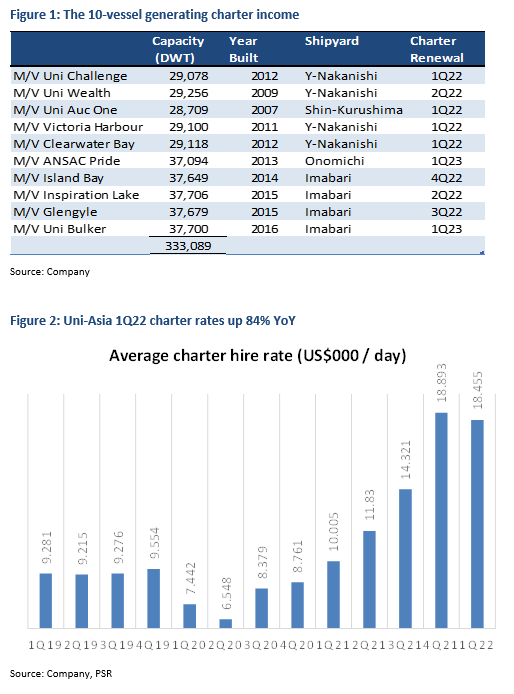
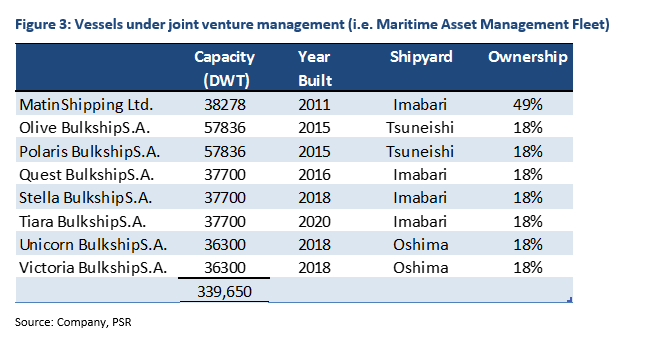
(i) Charter income: Around 80% of Uni-Asia FY21 PBT comes from charter income. It is the rental of the company’s 10 bulk carriers (Figure 1) to shipping lines. The charters for a fixed period (called time charters) on a fixed daily rate. The smaller vessels are typically chartered out for six months and larger vessels for around a year. New vessels upon delivery tend to be chartered for five years to match the loan tenure. Around nine of the 10 vessels are due for renewal this year (Figure 1) and charter rates have been surging since 1Q21 (Figure 2). The key minor bulk cargo is grains, cement, steel, fertiliser, forest products and coal.
(ii) Sale of properties under development: Revenue is generated from the sale of Alero properties. Gains from the sale of Alero projects were previously recognised as investment gains.
(iii) Fee income: Fee income comes from multiple sources: i) Ship brokerage fee from securing charters for the vessels under management and other third-party customers and sale and purchase of ships.; ii) Project arrangement fees from the arrangement of finance, acquisition, and disposal of properties in Hong Kong and Japan and shipping joint ventures; iii) Asset management fee of Alero property projects in Japan.
(iv) Investment returns: The source of returns are from sales of vessels, fair value gains and gains from the sale of Hong Kong property investments. For FY22e, we expect the bulk of the gains to come from Alero property projects. Sales of Hong Kong properties are expected to be weaker due to the lockdowns still underway.
Expenses
The largest operating cost is voyage expenses to operate the bulk carrier vessels. Around 1/3 of voyage expenses are crew and crew-related costs. Other costs include lubricant oil, consumables, cables, ropes, repairs and maintenance. Fuel cost is not borne by the vessel operator but by the shipping operator. After voyage expenses, the next largest cost is depreciation and amortisation of the vessels. The depreciation period of vessels is around 20 years. Fair valuation above book is implemented for assets in the joint venture.
Margins
Margins are volatile depending on the cycle of the three key businesses. Charter income margins (revenue less voyage expense) have swung from -18% to 57% over the past three years. Maritime services income is stable at around US$0.5mn PBT p.a. Maritime asset management margin is also volatile depending on investment and fair value gains.
Balance Sheet
Assets: Most of the assets in the balance sheet are shipping vessels (59%), which are the 10 bulk tankers. The next largest is cash (16%), investments (14%) and investment properties and properties under development (7%). Investments are predominantly Hong Kong commercial properties. Properties under development are the residential projects in Japan (Alero).
Liabilities: Of the US$98mn in total liabilities, US$84mn or 85% are bank borrowings. The bank borrowings are secured against the vessels and properties. The effective interest rate of the loans ranges from 0.6% to 2.45%, as per FY21. Net borrowings are currently USS$78mn, which is expected to decline to U$47mn with free cash flows (FCF) of US$34mn expected in FY22e.
Cash Flow
FCF generated over the past three years has been strong. Cumulative FCF is US$67mn. Reasons for cash-flows above net profits is due to low CAPEX of only US$2mn p.a. versus depreciation of around US$10mn p.a. We believe there are no plans to purchase vessels in the next two years until there is clarity of the engine type that can meet IMO 2030 regulations. Working capital needs have also been minimal as charters are paid one month in advance.
Business Model
Un-Asia is essentially in 4 core businesses – bulk ship owner, investment properties and management of shipping and property assets for 3rd party. Uni-Asia splits the business into
- Ship owning and chartering: Established in 2010 as Uni-Asia Shipping Ltd, this division build up a portfolio of 10 wholly-owned dry bulk carriers. These 10 sit on the balance sheet of Uni-Asia and property plant and equipment. Revenue is dependent on charter rates and hire days. In FY21, this division enjoyed a major turnaround in earnings from a PBT loss of US$11.2mn to a PBT of US$18.9mn.
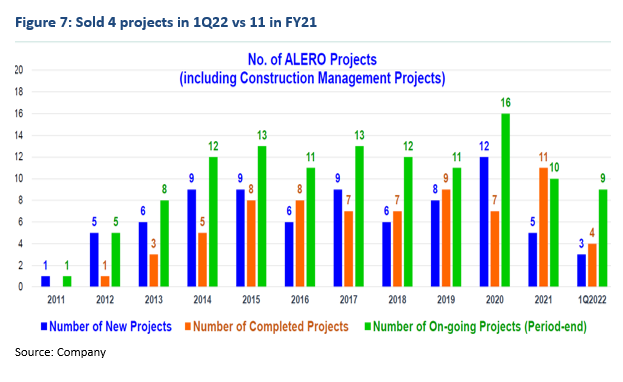
- Maritime asset management: Manage a portfolio of 8 dry bulk carriers with shareholdings of 18% to 49% (Figure 3). The assets are held on the balance sheet as investments. Uni-Asia will charge the joint venture various fees – administration fees (e.g. operating and accounting), acquisition and disposal fees, loan arrangement fees and brokerage fees when leasing out vessels. The equity stake will also allow the company to enjoy dividend income, disposal and fair value gains. Over its 25-year history, this division has arranged more than 140 deals with a total value exceeding US$8bn. The average profit before tax over the past three years has been US$1.5mn per annum.
- Maritime services: The division is operated through subsidiaries Uni Ships and Management Ltd (100%) and Wealth Ocean Ship Management (Shanghai) Co. Ltd (51%). Services provided include commercial/technical management of ships and brokerage services for chartering, sale and purchase of ships. The average profit before tax over the past three years has been US$0.5mn per annum. The appeal of hiring Chinese shipping crew may wane due to rising wages compared to other countries such as the Philippines.
- Property (ex-Japan): Uni-Asia will invest in office buildings in Hong Kong with varying stakes of between 2.5% to 8.3%. It has invested in 8 Hong Kong property projects to date. The first project was in 2010 by partnering developer First Group Holdings Limited in a project at 35 Hung Tung Road. First Group has been the partner in all 8 projects. First Group Holdings will manage and market these projects. The first 3 projects had been completed and generated returns of more than US$20mn. The 4th and 5th projects are ready for sale and the 6th will be ready for sale in 2022. The sale of units in projects have been slow especially due to the lockdown and movement restrictions in Hong Kong.
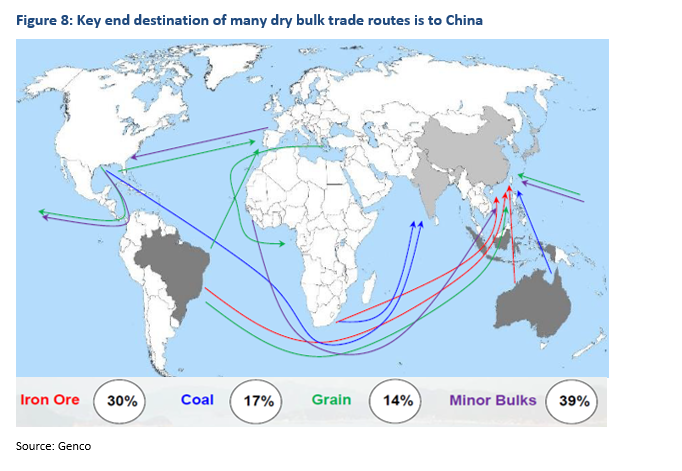
- Property (Japan): Uni-Asia will invest in and develop small residential property projects in Tokyo, named “Alero” Series (Figure 6). The land is purchased and developed into 4-5 storey buildings with 10-30 units of studio or maisonette type flats. Once tenanted the completed projects are typically sold en-bloc. In FY21, 11 Alero projects were sold (Figure 7, number of completed projects) with another 4 sold in 1Q22. The pipeline of new projects of only 3 is the weakest since 2013.
Industry
In shipping, dry bulk cargo is almost half of seaborne trade volume (Figure 8). There are around 12,700 dry bulk vessels globally. Dry bulk carriers transport unpackaged bulk cargo, major bulks (iron ore, coal, grains) and minor bulks (fertilizer, cement, sulphur, forest products). Major bulks are around 60% of cargo shipped by tonne-miles. The end destination of many key routes is to China. The key cargo includes the transport of iron ore and grains from Brazil to China and from Australia to China (Figure 8). Dy bulk ship can be separated by DWT capacity (Appendix 1). Uni-Asia 10 vessels are all Handysize, or less than 40k DWT. Above Handysize is the Supramax, Handymax and Ultramax category. We designate all three as Supramax. The 2nd largest category is the Panamax. It refers to the maximum size of a vessel than can transit the Panama Canal. The largest sized bulk carriers are the Capesize. Because they are too large to transit the Panama Canal and need to travel around Cape Horn, South Africa.
The Baltic Dry Index (BDI) enjoyed two major upcycles. The first was in 2004 after China entered the WTO. Then came the super cycle in 2008 following the surge in infrastructure and property projects in China. From 2010, the BDI has been languishing below 2000 to (monthly) lows of 487 in January 2020. Excess supply and slowdown in China were major drivers of the weakness. A significant pick-up in the index occurred in June 2020 due to major supply chain bottlenecks, especially at the ports. The BDI almost quadrupled over five months from 487 in January to 1800 in June 2020.
Source: Phillip Capital Research - 1 Jul 2022
More articles on Trader Hub
CSOP IEdge S-REIT Leaders Index ETF – The Deeper Discounted Singapore REIT ETF
Created by traderhub8 | Jun 12, 2024
Valuetronics Holdings Ltd- Get Paid as Customer Base Is Refreshed
Created by traderhub8 | Jun 03, 2024
Discussions
Be the first to like this. Showing 0 of 0 comments
Post a Comment
Featured Posts
New Update. Discover investment communities that resonate with your ideas
Trade Confidently & Analyze Charts Conveniently - Download VCPlus IOS & Android App Now!
Latest Videos


Apps


Top Articles
1
THE SINGAPOREAN INVESTOR
Investing in Singapore's Hospitality Scene: A Look at the 5 Listed REITs
2
RHB Investment Research Reports
Food Empire - Expanding Ingredients Capability in Vietnam; BUY
3
RHB Investment Research Reports
ST Engineering - Rolling Forward Our Valuation; Reiterate BUY
4
CEO Morning Brief
Singapore Home Sales Set for Worst Year Since Financial Crisis
5
SGX Market Dialogues
Kopi-C With GuocoLand’s Group CEO: ‘We Have Twin Engines for Growth’
#
Stock
Score
Daily Stocks
Stock Name
Last
Change
Volume
Stock Name
Last
Change
Volume
Stock Name
Last
Change
Volume
Featured Advertisers / Partners


Ride The Bull Short The Bear
CS Tan
4.9 / 5.0
This book is the result of the author's many years of experience and observation throughout his 26 years in the stockbroking industry. It was written for general public to learn to invest based on facts and not on fantasies or hearsay....