


Trader Hub
Singapore Banking – Time for OCBC to Catch Up

traderhub8
Publish date: Fri, 21 Jan 2022, 10:36 AM
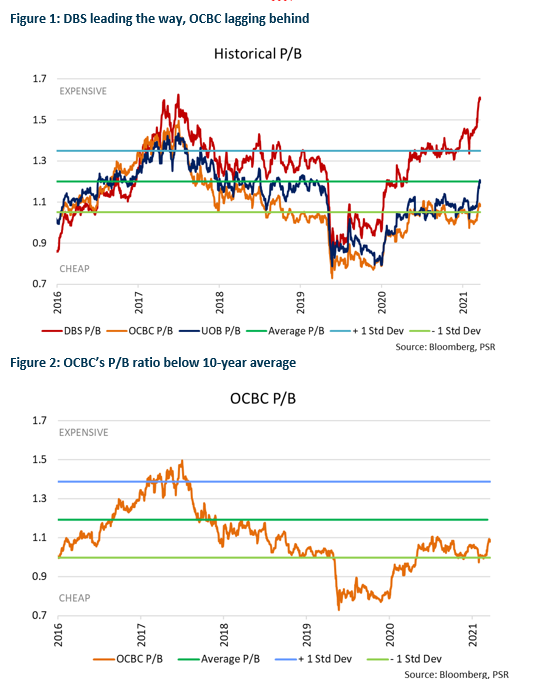
- DBS’ P/B ratio at record high while OCBC is lagging behind.
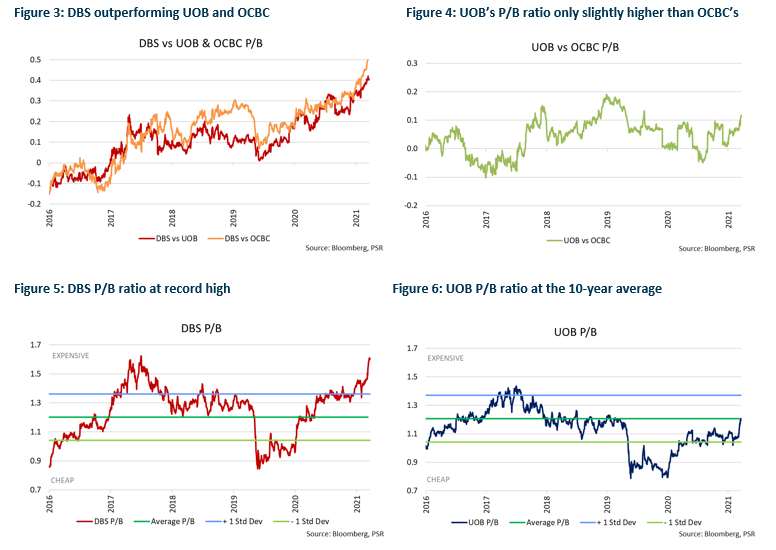
- OCBC’s P/B ratio below its 10-year average
- UOB’s P/B ratio at its 10-year average
- Maintain OVERWEIGHT. We remain positive on banks. We prefer OCBC due to its potential upside of 15.6%. OCBC will also be a beneficiary of rising interest rates, and there is also potential for higher dividends due to its higher CET1 ratio.
DBS way ahead while OCBC lags behind
DBS’ current Price to Book (P/B) ratio of 1.6x is at a record high and is 0.4x higher than the 10-year average P/B ratio of the three local banks of 1.2x (Figure 1). Meanwhile, UOB’s P/B ratio is at the 10-year average, while OCBC is lagging behind with a P/B ratio of 1.1x which is only slightly above the -1 standard deviation (s.d.) (Figure 2).
Time for OCBC to catch up
DBS’ share price is at an all-time high, with the difference between DBS’ P/B ratio and UOB’s and OCBC’s P/B ratio at a record high of 0.4x to 0.5x (Figure 3). However, UOB’s P/B ratio when compared to OCBC’s is relatively moderate, hovering at a difference of only 0.1x (Figure 4). DBS’ P/B ratio is currently way above the +1 s.d. and is at a record high (Figure 5), while UOB’s P/B ratio is at its 10-year average (Figure 6).
Source: Phillip Capital Research - 21 Jan 2022
Related Stocks
| Chart | Stock Name | Last | Change | Volume |
|---|
Market Buzz
More articles on Trader Hub
CSOP IEdge S-REIT Leaders Index ETF – The Deeper Discounted Singapore REIT ETF
Created by traderhub8 | Jun 12, 2024
Valuetronics Holdings Ltd- Get Paid as Customer Base Is Refreshed
Created by traderhub8 | Jun 03, 2024
Discussions
Be the first to like this. Showing 0 of 0 comments
Post a Comment
Featured Posts


Latest Videos


Apps


Top Articles
1
THE SINGAPOREAN INVESTOR
Investing in Singapore's Hospitality Scene: A Look at the 5 Listed REITs
2
RHB Investment Research Reports
Food Empire - Expanding Ingredients Capability in Vietnam; BUY
3
RHB Investment Research Reports
ST Engineering - Rolling Forward Our Valuation; Reiterate BUY
4
CEO Morning Brief
Singapore Home Sales Set for Worst Year Since Financial Crisis
5
SGX Market Dialogues
Kopi-C With GuocoLand’s Group CEO: ‘We Have Twin Engines for Growth’
#
Stock
Score
Daily Stocks
Stock Name
Last
Change
Volume
Stock Name
Last
Change
Volume
Stock Name
Last
Change
Volume
Featured Advertisers / Partners


Ride The Bull Short The Bear
CS Tan
4.9 / 5.0
This book is the result of the author's many years of experience and observation throughout his 26 years in the stockbroking industry. It was written for general public to learn to invest based on facts and not on fantasies or hearsay....