


THE SINGAPOREAN INVESTOR
Is ESCO Technologies a Buy? An In-Depth Analysis of its Financials, Debt, and Dividends

ljunyuan
Publish date: Wed, 17 Apr 2024, 11:00 AM
ljunyuan
0 331
My name is Jun Yuan, and I am the owner of The Singaporean Investor. I am a full-time retail investor and trader since April 2017, and in this website, I'd be sharing with you my personal analyses of Singapore-listed companies, along with advices relating to investing, as well as trading. You can find out more about me here, and check out my long-term portfolio here.

ESCO Technologies Inc. (NYSE:ESE) is a US-listed company that specialises in providing advanced technology solutions for the defence, aerospace, space, wireless, consumer electronics, healthcare, automotive, electric utility, and renewable energy industries.
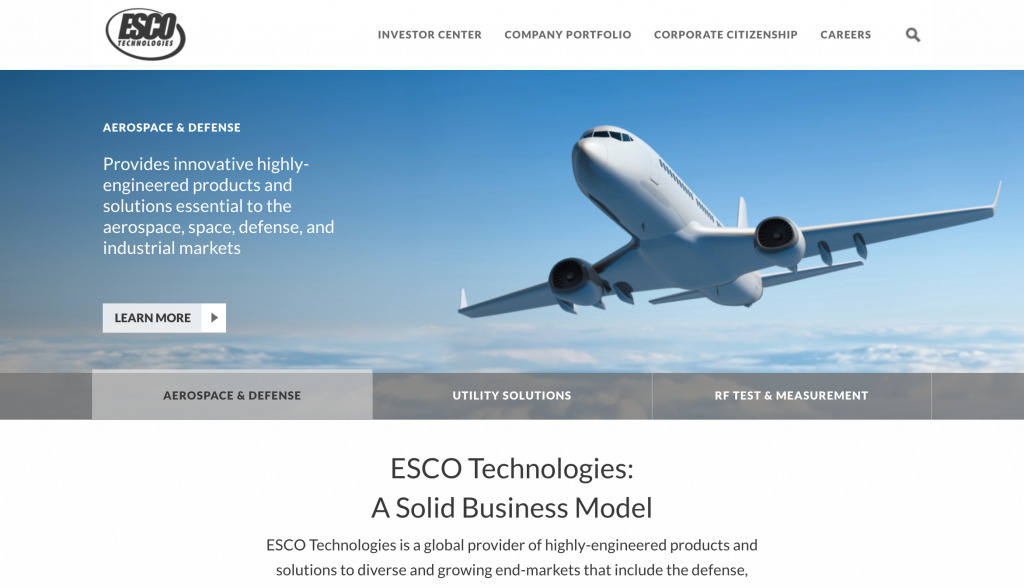
Image Source: ESCO Technologies’ Official Website – https://www.escotechnologies.com
As you can see from the screenshot of the company’s website above, it reports its revenue under 3 business segments (I try to explain what each business segment do as layman as I can):
(i) Aerospace & Defence (or A&D for short) – with 7 facilities in the US and 1 in Mexico, the business segment is involved with making specialised products mainly for airplanes, spacecraft, as well as submarines. In the latest financial year 2022/23 ended 30 September 2023 (i.e., FY2022/23), the business segment contributes 41% of the company’s total revenue;
(ii) Utility Solutions Group (or USG for short) – with 8 facilities in the US, 1 in Canada, and 10 outside North America, this business segment provides tools and services that manages power grids to make sure equipments used to transmit high-voltage power is functioning properly, along with making software and tools to aid in decision making in the renewable energy sector, particularly those working with wind and solar power. In FY2022/23, this business segment contributed 36% towards the company’s total revenue;
(iii) RF (Radio Frequency) Test & Measurement (or Test for short) – with 4 facilities in the US, and 6 out of the country, it is involved in creating products and systems for testing and managing both radio frequency and sound crucial for scientific research, making sure products meet government rules, as well as health, safety, and security purposes In FY2022/23, the business segment contributed 23% towards the company’s total revenue.
From the above, all 3 business segments contributed rather evenly towards the company’s total revenue (and its one aspect about the company that I like). But this alone is definitely not enough to help me make my investment decision on the company.
In the rest of this post, you will find my review of ESCO Technologies’ financial performances, debt profile, and dividend payout recorded over the last 9 financial years (i.e., between FY2024/25 and FY2022/23), whether or not its current traded price is considered to be trading at a discount or premium, and my ‘fair value price’ of the company.
Let’s begin:
Financial Performance
In this section, you will find my review of ESCO Technologies Inc.’s financial performance in terms of its total revenue and net profit, gross and net profit margins, as well as return on equity (or RoE for short) recorded between FY2024/25 and FY2022/23 (a total of 9 financial years):
Total Revenue & Net Profit (US$’mil):
| FY 2014/15 | FY 2015/16 | FY 2016/17 | FY 2017/18 | FY 2018/19 | |
| Total Revenue (US$’mil) | $537m | $571m | $686m | $684m | $726m |
| Net Profit (US$’mil) | $43m | $46m | $54m | $92m | $81m |
| FY 2019/20 | FY 2020/21 | FY 2021/22 | FY 2022/23 | ||
| Total Revenue (US$’mil) | $730m | $715m | $858m | $956m | |
| Net Profit (US$’mil) | $99m | $63m | $82m | $93m |
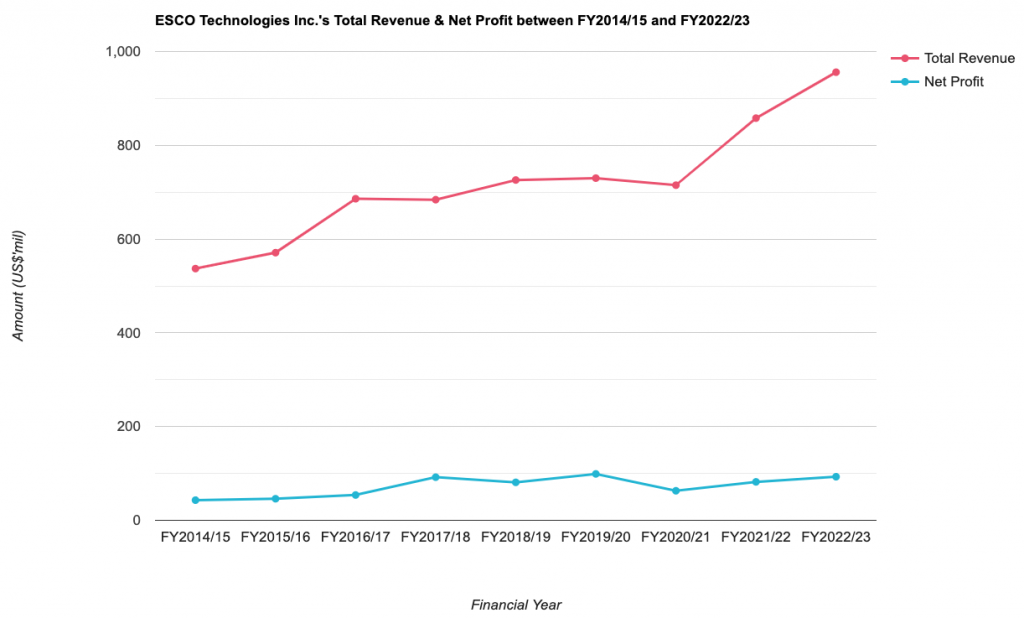
Both the company’s total revenue and net profit saw year-on-year (y-o-y) declines in 2 out of 9 years – for its total revenue, it saw a slight dip of 0.3% and 2.1% in FY2017/18 and FY2020/21 respectively; for its net profit, it fell by 12.0% and 36.4% in FY2018/19 (due to charges related to cost reduction actions taken in Technical Packaging and at Doble, costs incurred to move the aircraft/aerospace business from VACCO to PTI, and one-time purchase accounting charges related to the July 2019 acquisition of Globe Composite Solutions LLC) and FY2020/21 (as a result of a $1.8m of after-tax charges mainly consisting of purchase accounting adjustments related to the Phenix and Altanova acquisitions, restructuring costs primarily within the USG segment, and purchase accounting adjustments related to the Phenix and Altanova acquisitions) respectively.
In terms of growth of these 2 financial numbers over the years, if you look at the chart above, they have been on a stable, upward moving trend. Throughout the 9-year period I have looked at, the compound annual growth rate (CAGR) of its total revenue was at 6.6%, and its net profit was at 8.9% – both pretty decent in my opinion.
Gross & Net Profit Margins:
The following table is ESCO Technologies Inc.’s gross and net profit margins I have computed:
| FY 2014/15 | FY 2015/16 | FY 2016/17 | FY 2017/18 | FY 2018/19 | |
| Gross Profit Margin (%) | 37.6% | 38.5% | 36.3% | 38.6% | 39.7% |
| Net Profit Margin (%) | 8.0% | 8.1% | 7.9% | 13.5% | 11.2% |
| FY 2019/20 | FY 2020/21 | FY 2021/22 | FY 2022/23 | ||
| Gross Profit Margin (%) | 37.3% | 37.8% | 38.8% | 39.3% | |
| Net Profit Margin (%) | 13.6% | 8.8% | 9.6% | 9.7% |
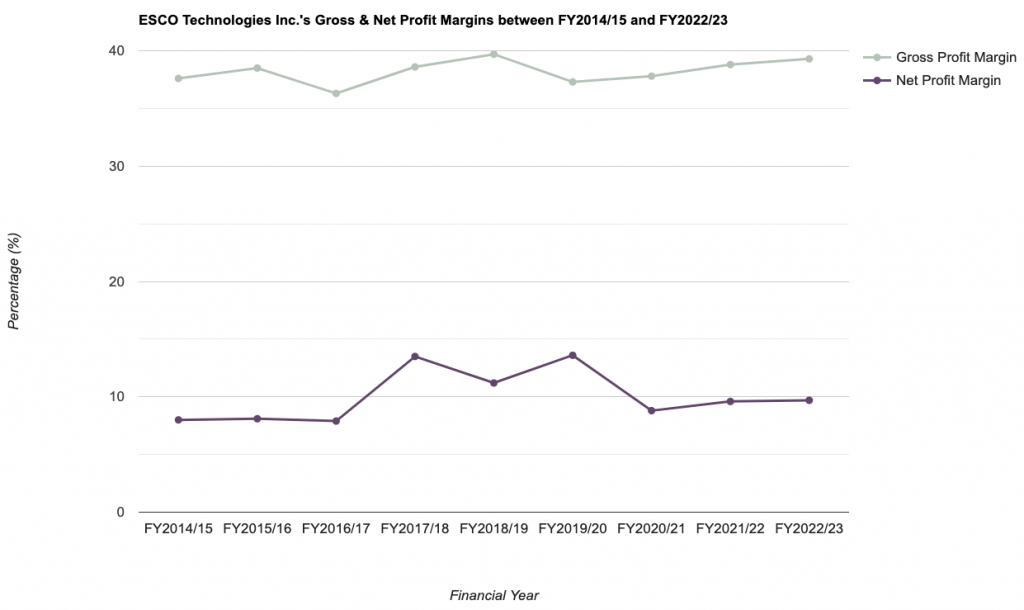
ESCO Technologies’ gross profit margin has been quite stable throughout the last 9 years I have looked at, where they have been maintained at a high-30+% range.
While its net profit margin have fluctuated slightly over the same time period, but in the most recent 3 financial years (i.e., between FY2020/21 and FY2022/23), it has been on a stable upward moving trend (where it climbed from 8.8% to 9.7%). However, I understand some may feel that it may be on the low-side.
Return on Equity:
In layman terms, it is a measure of how much profits (in percentage terms) a company is able to generate for every dollar of shareholders’ money it uses in its business.
When it comes to my selection criteria, I would prefer companies that are able to maintain this financial ratio at above 15.0% over the years that I look at.
The following table is ESCO Technologies Inc.’s Return on Equity over the last 9 financial years which I have computed:
| FY 2014/15 | FY 2015/16 | FY 2016/17 | FY 2017/18 | FY 2018/19 | |
| Return on Equity (%) | 7.4% | 7.5% | 8.0% | 12.1% | 9.8% |
| FY 2019/20 | FY 2020/21 | FY 2021/22 | FY 2022/23 | ||
| Return on Equity (%) | 10.3% | 6.2% | 7.8% | 8.2% |
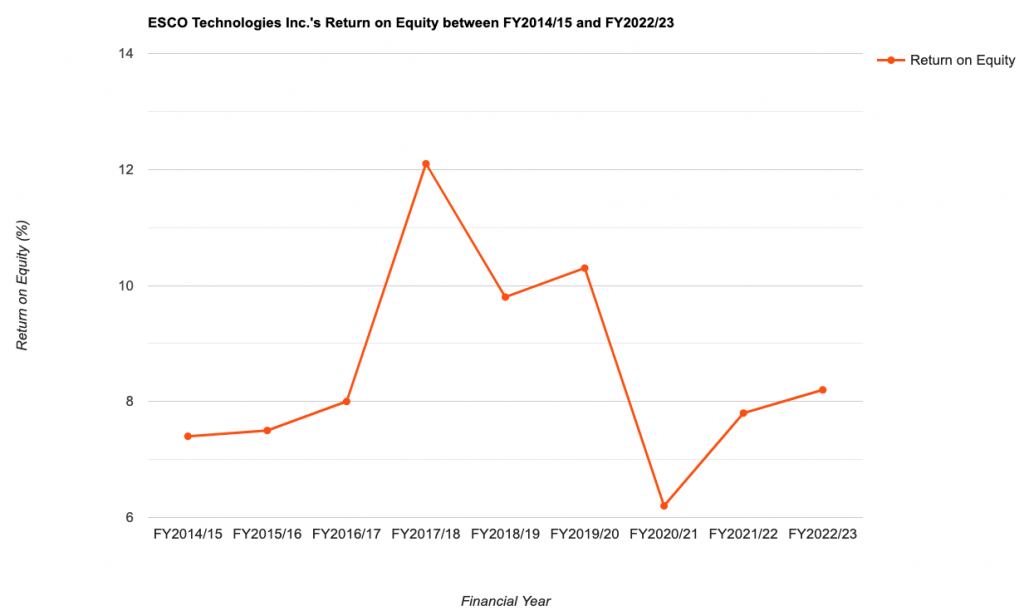
Similar to its net profit margin, the company’s RoE have also saw some slight fluctuations over the years. The RoE recorded is also considered to be on the low-side.
Debt Profile
My selection criteria when it comes to a company’s debt profile is one that have minimal or no debt, as well as one in a net cash position.
Did ESCO Technologies Inc.’s debt profile satisfy this selection criteria of mine? Let us find out in the table below (where you’ll find the company’s debt profile recorded between FY2024/15 and FY2022/23):
| FY 2014/15 | FY 2015/16 | FY 2016/17 | FY 2017/18 | FY 2018/19 | |
| Cash & Cash Equivalents (US$’mil) | $39m | $54m | $46m | $30m | $62m |
| Total Borrowings (US$’mil) | $50m | $110m | $275m | $263m | $285m |
| Net Cash/ Debt (US$’mil) | -$11m | -$56m | -$229m | -$233m | -$223m |
| FY 2019/20 | FY 2020/21 | FY 2021/22 | FY 2022/23 | ||
| Cash & Cash Equivalents (US$’mil) | $53m | $56m | $98m | $42m | |
| Total Borrowings (US$’mil) | $62m | $154m | $153m | $102m | |
| Net Cash/ Debt (US$’mil) | -$9m | -$98m | -$55m | -$60m |
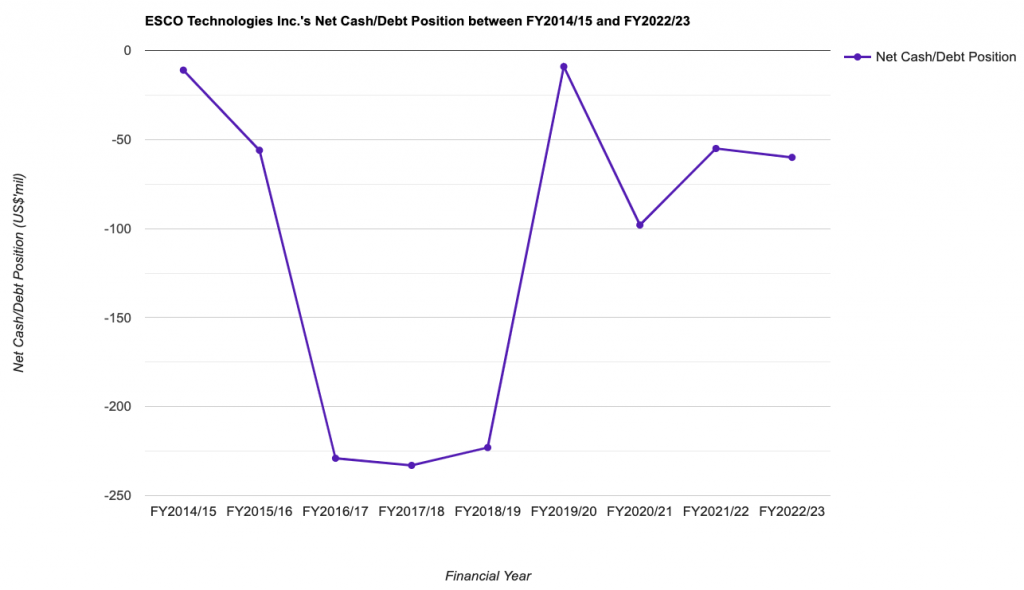
While the company is in a net debt position throughout the entire 9-year period I have looked at, but looking at its total borrowings between FY2020/21 and FY2022/23, it has been on a decline (which is good to note).
Its current ratio has also been maintained at between 1.7 and 2.1 in the same time period, suggesting the company have no difficulty in fulfilling its short-term debt obligations if it is required to.
Dividend Payout to Shareholders
As a shareholder of ESCO Technologies Inc., you will receive a dividend once every quarter. However, if you are a Singaporean investing in a US-listed company, do take note that all dividend payouts are subjected to a 30.0% withholding tax (hence the dividend payout you receive is 30.0% lesser than the amount declared).
The table below is the company’s dividend payout over the last 9 financial years (i.e., between FY2014/15 and FY2022/23):
| FY 2014/15 | FY 2015/16 | FY 2016/17 | FY 2017/18 | FY 2018/19 | |
| Dividend Per Share (US$/share) | $0.32 | $0.32 | $0.32 | $0.32 | $0.32 |
| FY 2019/20 | FY 2020/21 | FY 2021/22 | FY 2022/23 | ||
| Dividend Per Share (US$/share) | $0.32 | $0.32 | $0.32 | $0.32 |
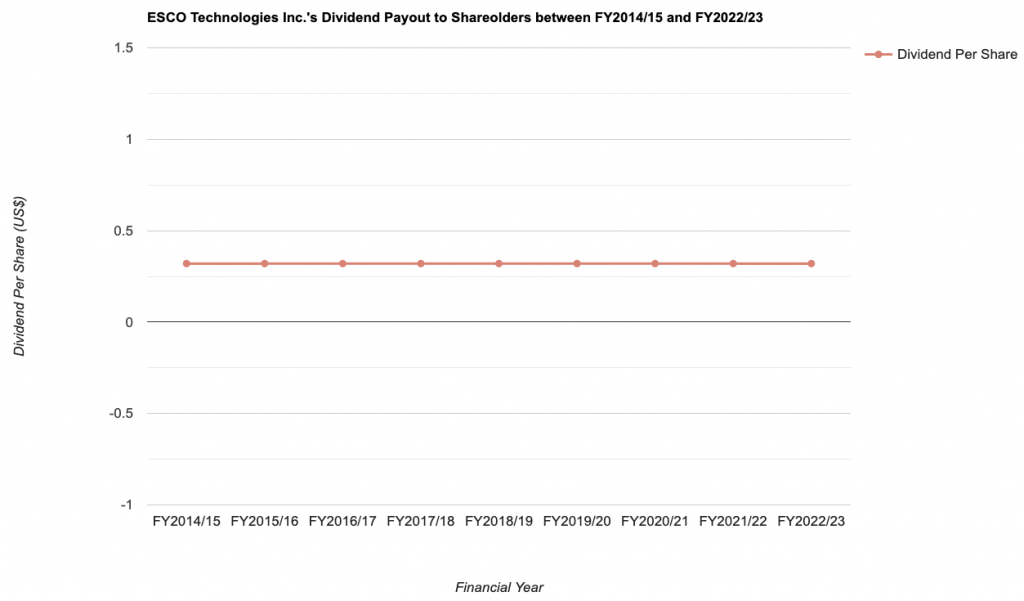
The dividend payout by the company has remained stagnant (at $0.32/share) over the years – this is something to take note if you are an income investor.
Is the Current Traded Price of ESCO Technologies Inc. Considered to be Trading at a ‘Discount’ or ‘Premium’?
At the time of writing this post, ESCO Technologies is trading at US$98.88 (as at market close on 16 April 2024).
The following table is a comparison of its current valuations (based on its current traded price) and its 9-year average to find out whether the current traded price is trading at a ‘discount’ or at a ‘premium’:
| Current | 9-Year Average | |
| P/S Ratio | 2.6 | 2.5 |
| P/B Ratio | 2.2 | 3.5 |
| Dividend Yield | 0.3%^^ | 0.5% |
As a result of its current P/S ratio being higher than average, and at the same time, its current dividend yield being lower than average, I conclude that the current traded price of ESCO Technologies is at a ‘premium’.
Finally, my ‘fair value price’ based on the company’s 9 year valuation is $91.48 – hence, the current traded price of the company is at a slight 8.1% ‘premium’.
Closing Thoughts
ESCO Technologies Inc. has a well-diversified source of income coming from each of its 3 business segments – with its Aerospace & Defence, Utility Solutions Group, and RF Test & Measurement contributing 41%, 36% and 23% towards the company’s total revenue in FY2023 respectively.
As far as its financial performance goes, no doubt there’s some slight declines in its total revenue and net profit over the last 9 years I have looked at, but overall, they are on a stable upward moving trend, with the former recording a CAGR of 6.6% and the latter at 8.9%. Gross profit margin have also been maintained at a consistent rate in the same time period.
However, its net profit margin and return on equity over the years are at the low-side (where they are at a high-single digit percentage in most years) At the same time, the company is in a net debt position throughout the entire 9-year period I have looked at.
In terms of its dividend payout, no doubt as a shareholder, you will receive a dividend once every 3 months, but its dividend payout not grown in the last 9 years (it has remained at $0.32/share) – this is something you’ll have to take note if you are an income investor.
Finally, as far as its current traded price is concerned, it is currently at a 8.1% ‘premium’ to its ‘fair value price’ of $91.48 (which I have computed based on its 9-year valuations).
With that, I have come to the end of my review of ESCO Technologies Inc. I hope that after reading the contents above, you now have a good understanding of the US-listed company in terms of its businesses, as well as what are some of the ‘good’ and ‘not so good’ aspects about its financial performances, debt profile, and dividend payout over the last 9-years. Do take note that this post is by no means any recommendation to buy or sell the company’s shares. You should always do your own due diligence before you make any investment decisions.
Disclaimer: At the time of writing, I am not a shareholder of ESCO Technologies Inc.
The post Is ESCO Technologies a Buy? An In-Depth Analysis of its Financials, Debt, and Dividends first appeared on The Singaporean Investor.
More articles on THE SINGAPOREAN INVESTOR
DBS, UOB, or OCBC - Which Singapore Bank Led the Pack in Q1 FY2024?
Created by ljunyuan | May 13, 2024
DBS, UOB, and OCBC's Business Updates for Q1 FY2024: What You Need to Know
Created by ljunyuan | May 10, 2024
An Analysis of Results by the Trio of Mapletree REITs for Q4 & FY2023/24
Created by ljunyuan | Apr 30, 2024
CapitaLand Integrated Commercial Trust's AGM for FY2023: My Summary
Created by ljunyuan | Apr 29, 2024
CapitaLand Ascendas REIT's AGM for FY2023: Key Highlights to Take Note of
Created by ljunyuan | Apr 29, 2024
Discussions
Be the first to like this. Showing 0 of 0 comments
Post a Comment
Featured Posts


Apps


Top Articles
1
CEO Morning Brief
2
RHB Investment Research Reports
3
RHB Investment Research Reports
4
Trader Hub
5
RHB Investment Research Reports
ComfortDelGro - Seasonally Weak 1Q24; Better 2H24 Expected; BUY
#
Stock
Score
Daily Stocks
Stock Name
Last
Change
Volume
Stock Name
Last
Change
Volume
Stock Name
Last
Change
Volume
Featured Advertisers / Partners


Ride The Bull Short The Bear
CS Tan
4.9 / 5.0
This book is the result of the author's many years of experience and observation throughout his 26 years in the stockbroking industry. It was written for general public to learn to invest based on facts and not on fantasies or hearsay....