


SGX Singapore Stocks & Forex Live Picks
GOLD | SILVER | COPPER | CRUDE Technical Analysis

Your Advisor
Publish date: Thu, 27 Mar 2014, 08:47 PM
Your Advisor
0 10,453
Blog for SGX Singapore Stock & Forex Recommendations gives you Live Stock Picks, we provide all SGX Stock Picks, Singapore Share Prices, Forex Trading Recommendation along with STI Quotes. Get Live SGX Singapore Picks.
GOLD
Gold edged slightly higher overnight to open at 1313.50/1314.50, which was also the intraday high. Following the open it dipped to a low of 1300.25/1301.25 as the dollar strengthened and equities gained momentum following better-than-expected U.S. economic data that showed an increase in sales of durable goods. The slide in gold prices was also attributed to easing of tensions between Russia and the West, which suppressed demand for safe haven assets. The metal closed the day at 1302.50/1303.50.
 Gold traded lower today, closing at 1302 and coming dangerously close to the 200-day moving average at 1296. A close below that level would be our stop-loss on our long-term bullish gold view. Resistance is at 1316/17, the high of the past two sessions.
Gold fell as encouraging U.S. manufacturing data reduced bullion's appeal to institutional investors as a hedge against economic uncertainty
U.S. Federal Janet Yellen suggested interest rates could rise in the first half of 2015, raised the opportunity cost of holding non-yielding bullion.
SPDR gold trust holding dropped by 1.80 tonnes i.e. 0.22% to 816.97 tonnes from 818.77 tonnes.
SILVER
Silver was mostly unchanged overnight, opening at 19.97/20.02. It briefly climbed to a high of 20.01/20.06 before retreating on the back of gold to a low of 19.73/19.78, prior to concluding the session below the $20 mark at 19.76/19.81.
Silver had a bearish close today, closing lower at 19.76. We are bearish silver, looking for a test of the base of the consolidation that has been in place since early December, around the 18.83 low.
 The gold-silver ratio is trading higher today at 65.90. There is support at 65.02, the 76.4% retracement of the last downtrend in the ratio from 67.47 high to 57.09 low. Uptrend support comes in at 62.99. We are bullish the ratio, targeting a test of the double top in the 67.50 area.
Silver prices dropped after official data showed that U.S. orders for long lasting manufactured goods came in higher-than-forecast in February.
Prices has been under heavy selling pressure amid growing expectations that the Federal Reserve will raise interest rates sooner than expected.
The Commerce Department reported that U.S. durable goods orders rose 2.2% last month, snapping two months of declines and surpassing expectations for a 1% increase.
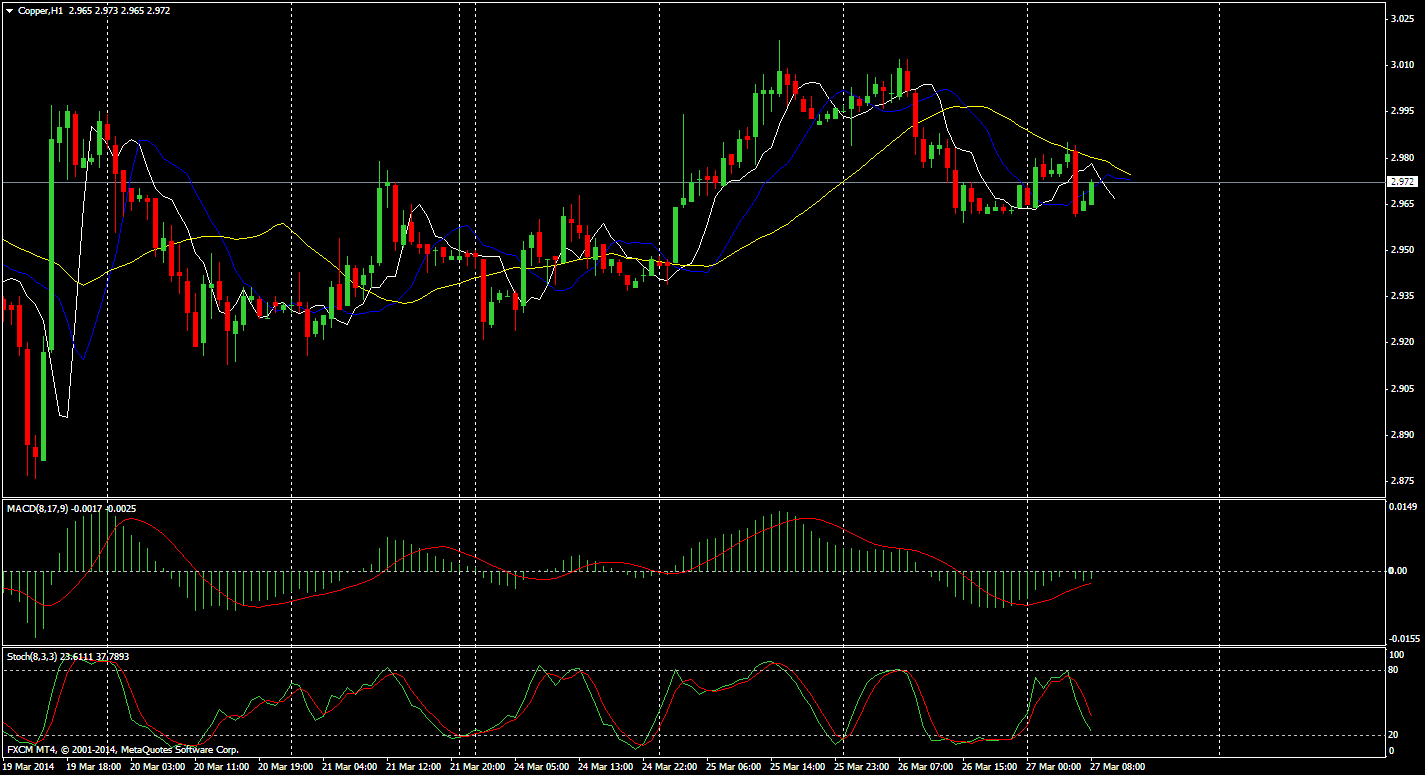
COPPER
On the Comex division of the New York Mercantile Exchange, copper futures for May delivery fell to a session low of $2.982 a pound, before trimming losses to last trade at $2.985 during European morning hours, down 0.68%, or 2.0 cents.
Copper rallied to $3.045 a pound on Tuesday, the most since March 11, before settling at $3.005 a pound, up 2.04%, or 6.0 cents.
Futures were likely to find support at $2.939 a pound, the low from March 25 and resistance at $3.045 a pound, the high from March 25.
 The U.S. is to release data on durable goods orders later in the session.
Data on Tuesday showed that U.S. consumer confidence improved more than expected in March. However, a separate report said that new home sales fell by the most in five months in February, indicating continued weakness in the housing sector.
Copper rallied on Tuesday amid growing hopes that China will unveil fresh stimulus measures to boost slowing economic growth.
Data released on Monday showed that Chinese manufacturing activity deteriorated for a third successive month in March.
The industrial metal fell to $2.877 a pound on March 19, the lowest since July 2010, amid growing concerns over the health of China's economy.
Copper prices fell from the previous session's two-week high on Wednesday, as investors looked ahead to key U.S. economic data later in the day for further indications on the strength of the economy and the future course of monetary policy.
CRUDE
On the New York Mercantile Exchange, West Texas Intermediate crude oil for delivery in May traded at $100.32 a barrel, up 0.05%, after hitting an overnight session low of $99.11 a barrel and a high of $100.13 a barrel.
Prices for the global Brent oil futures contract rose four cents to settle at $107.03 a barrel on the ICE Futures Europe exchange on Wednesday.
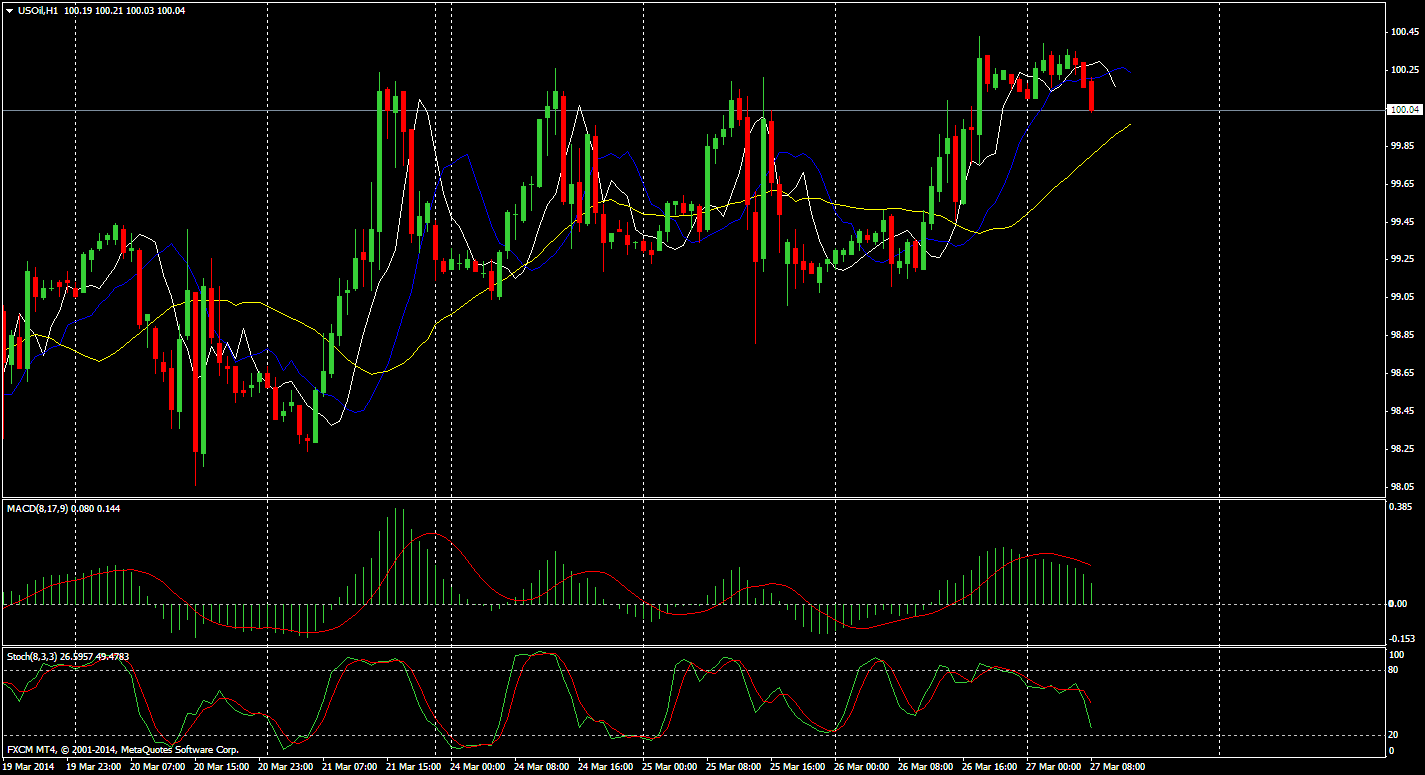 Overnight, oil prices firmed after the Commerce Department reported that U.S. durable goods orders rose 2.2% in February, wiping out two months of declines and surpassing expectations for a 1.0% increase.
Core durable goods orders, which exclude transportation items, inched up 0.2%, slightly below forecasts for a 0.3% gain.
The numbers fueled expectations for a more sustained pickup in the U.S. economy, which should hike demand for more fuel and energy.
Weekly inventory data gave oil prices a boost as well.
The U.S. Energy Information Administration said in its weekly report that U.S. crude oil inventories rose by 6.6 million barrels in the week ended March 21, above expectations for an increase of 2.8 million barrels.
The EIA also reported a 1.3 million barrel draw at a delivery point in Cushing, Oklahoma, which was larger expected and eclipsed the otherwise bearish 6.6 million-barrel build.
Total U.S. crude oil inventories stood at 382.5 million barrels as of last week.
Crude oil prices edged slightly higher in Asia on Thursday from a morning drop that followed overnight gains on better-than-expected reports on U.S. durable goods and oil inventories.
Technical Levels
| SUPPORT 1 | SUPPORT 2 | RESISTANCE 1 | RESISTANCE 2 | |
| GOLD | 1296 | 1288 | 1314 | 1324 |
| SILVER | 19.67 | 19.59 | 20.08 | 20.16 |
| COPPER | 2.9930 | 2.9755 | 3.0380 | 3.0830 |
| CRUDE | 99.42 | 98.58 | 100.78 | 101.30 |
Global Economic Data
| TIME :IST | DATA | PRV | EXP | IMPACT |
| 6.00P.M | Unemployment Claims | 320k | 326k | STRONG |
| 6.00P.M | FOMC Member Pianalto Speaks | - | - | MEDIUM |
| 6.00P.M | Final GDP q/q | 2.4% | 2.7% | MEDIUM |
| 7.30P.M | Pending Home Sales m/m | 0.1% | 0.1% | STRONG |
Unemployment Claims
| Source | Department of Labor (latest release) |
| Measures | The number of individuals who filed for unemployment insurance for the first time during the past week; |
| Usual Effect | Actual < Forecast = Good for currency; |
| Frequency | Released weekly, 5 days after the week ends; |
| Next Release | Apr 3, 2014 |
| FF Notes | This is the nation's earliest economic data. The market impact fluctuates from week to week - there tends to be more focus on the release when traders need to diagnose recent developments, or when the reading is at extremes; |
| Why Traders Care | Although it's generally viewed as a lagging indicator, the number of unemployed people is an important signal of overall economic health because consumer spending is highly correlated with labor-market conditions. Unemployment is also a major consideration for those steering the country's monetary policy; |
| Also Called | Jobless Claims, Initial Claims; |
Final GDP q/q
| Source | Bureau of Economic Analysis (latest release) |
| Measures | Annualized change in the inflation-adjusted value of all goods and services produced by the economy; |
| Usual Effect | Actual > Forecast = Good for currency; |
| Frequency | Released quarterly, about 90 days after the quarter ends; |
| Next Release | Jun 25, 2014 |
| FF Notes | While this is q/q data, it's reported in an annualized format (quarterly change x4). The 'Previous' listed is the 'Actual' from the Preliminary release and therefore the 'History' data will appear unconnected. There are 3 versions of GDP released a month apart - Advance, Preliminary, and Final. The Advance release is the earliest and thus tends to have the most impact; |
| Why Traders Care | It's the broadest measure of economic activity and the primary gauge of the economy's health; |
Pending Home Sales m/m
| Source | National Association of Realtors (latest release) |
| Measures | Change in the number of homes under contract to be sold but still awaiting the closing transaction, excluding new construction; |
| Usual Effect | Actual > Forecast = Good for currency; |
| Frequency | Released monthly, about 28 days after the month ends; |
| Next Release | Apr 28, 2014 |
| FF Notes | This data is released about a week later than Existing Home Sales, but it's more forward-looking as a contract is signed several weeks before the home is counted as sold; |
| Why Traders Care | It's a leading indicator of economic health because the sale of a home triggers a wide-reaching ripple effect. For example, renovations are done by the new owners, a mortgage is sold by the financing bank, and brokers are paid to execute the transaction; |
| Also Called | Pending Resales; |
| Source | National Association of Realtors (latest release) |
More articles on SGX Singapore Stocks & Forex Live Picks
There's No Recession, but a Market Correction Could Cause One
Created by Your Advisor | May 10, 2017
TECH TARGETS: EUR/USD, GBP/USD, USD/JPY, AUD/USD, NZD/USD - UOB
Created by Your Advisor | Mar 23, 2017
M Asia Trade Tech Targets: EUR/USD, AUD/USD, NZD/USD, USD/JPY - UOB
Created by Your Advisor | Mar 22, 2017
Discussions
Be the first to like this. Showing 0 of 0 comments
Post a Comment
Featured Posts


Latest Videos


Apps


Top Articles
1
CEO Morning Brief
Singapore Post Shares Slide After CEO Fired Over Whistleblower Report
2
3
CEO Morning Brief
4
CEO Morning Brief
DBS Shares’ 43% Rally Seen Having More Legs as Wealth Fees Rise
5
Johor house best buy
#
Stock
Score
Daily Stocks
Stock Name
Last
Change
Volume
Stock Name
Last
Change
Volume
Stock Name
Last
Change
Volume
Featured Advertisers / Partners


Ride The Bull Short The Bear
CS Tan
4.9 / 5.0
This book is the result of the author's many years of experience and observation throughout his 26 years in the stockbroking industry. It was written for general public to learn to invest based on facts and not on fantasies or hearsay....