The Boring Investor
What Are Driving Those Numbers!
The quarterly earnings season has started and I have been busy reading the financial results. It is sometimes frustrating that the reports do not reveal much about why the business is doing well or poorly and whether the trend will continue. The reports contain a lot of numbers and some discussions, but most of the time, the discussions just regurgitate what the numbers already show. To illustrate what I mean, I will use M1's financial results as an example, but it is not the only company that has the issue.
The figure below from M1's financial results shows the numbers generated by the various business segments in 2Q2017. For instance, it shows that revenue for the mobile telco services segment dropped by 2.1% Year-on-Year (YOY) in 2Q2017, customer subscriptions rose by 4.5% YOY, etc. These are useful numbers to understand how well the business is doing. But they do not explain why revenue has fallen even though customer subscriptions have increased. By right, if customer subscriptions increase, revenue would also increase correspondingly, isn't it?
 |
| Fig. 1: Numbers |
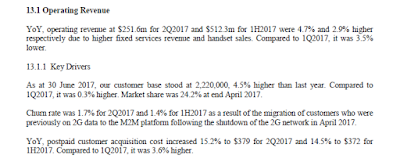
Following the numbers in the financial results is a discussion of those numbers. The figure below shows the level of sophistication of the discussion.
 |
| Fig. 2: Discussion |
The opening paragraph of the discussion says, "YOY, operating revenue at $251.6M for 2Q2017 and $512.3M for 1H2017 were 4.7% and 2.9% higher respectively due to higher fixed services revenue and handset sales. Compared to 1Q2017, it was 3.5% lower." Haven't all these information been reflected in the numbers already? What extra information do investors get after spending time to read the discussion?
What investors really want from the discussion is to understand the factors driving those numbers. Investors should not be left to guess why those numbers rise or fall and whether the trend would continue. An example of a good discussion is actually given by M1 in the second paragraph of Key Drivers, which explains why churn rate hit a high of 1.7% in 2Q2017 when the average historical churn rate is only 1.0%. It explains that "Churn rate was 1.7% for 2Q2017 and 1.4% for 1H2017 as a result of the migration of customers who were previously on 2G data to the M2M platform following the shutdown of the 2G network in April 2017." This gives investors assurance that customers did not desert M1 in droves in 2Q2017.
The discussion should not just be a repeat of what the numbers already show. If companies are serious about providing a discussion, I hope they would be more forthcoming and provide an intelligent discussion about the challenges the company faces and what plans does it have to overcome those challenges. Investors who are informed of these challenges and plans would be more willing to stick through thick and thin with the company when it is going through a difficult patch.
See related blog posts:
More articles on The Boring Investor
Discussions
Be the first to like this. Showing 0 of 0 comments


