An In-Depth Review of Suntec REIT's Q1 FY2024 Business Update
ljunyuan
Publish date: Thu, 25 Apr 2024, 10:07 AM

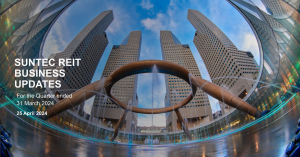
Mention about Suntec REIT (SGX:T82U), the first thing that comes to mind is the Suntec City Mall (which is one of the largest shopping malls in Singapore), Suntec City Office Towers, and Suntec Singapore Convention & Exhibition Centre – all of them in the same location. In fact, it is Singapore’s largest integrated commercial development.
However, not many know that they also own the following properties:
Singapore: One-third interest in One Raffles Quay, Marina Bay Financial Centre Towers 1 & 2, and Marina Bay Link Mall;
Australia: 100% interest in 31 Harris Street (Sydney), and 55 Currie Street (Adelaide), as well as a 50% interest in Southgate Complex, and Olderfleet, 477 Collins Street (both located in Melbourne);
United Kingdom: 50% interest in Nova Properties, and 100% interest in The Minster Building (both located in London).
Earlier this morning (25 April), the retail and office REIT published its business update for the 1st quarter of FY2024 ended 31 March 2024, and in this post, you will find my in-depth review of the Singapore-listed REIT’s key financial figures, portfolio occupancy and debt profile, as well as distribution payouts to unitholders.
Let’s begin:
Financial Performance (Q1 FY2023 vs. Q1 FY2024)
As this is a business update, the REIT only provided a snippet of its financial performance.
In the table below, you’ll find a comparison of the figures for the current quarter under review (i.e., Q1 FY2024) against that posted a year ago (i.e., Q1 FY2023):
| Q1 FY2023 | Q1 FY2024 | % Variance | |
| Gross Revenue (S$’mil) | $108.7m | $109.8m | +1.0% |
| Property Operating Expenses (S$’mil) | $32.4m | $36.4m | +12.3% |
| Net Property Income (S$’mil) | $76.3m | $73.4m | -3.8% |
| Distributable Income to Unitholders (S$’mil) | $44.5m | $44.0m | -1.1% |
My Observations: Suntec REIT’s results for the first quarter was a largely negative one – with the only positive being a slight improvement in its gross revenue, which can be attributed to a stronger operating performance from Suntec City Office, Mall, and Suntec Convention.
However, a huge jump in its property operating expenses (by 12.3% compared to last year) saw its net property income decline by 3.8%. Distributable income also fell by 1.1% as a result due to completion of capital distribution of S$5.8m, higher financing cost of S$2.4m, and vacancies at 55 Currie Street, Southgate Complex, and The Minster Building.
Portfolio Occupancy Profile (Q4 FY2023 vs. Q1 FY2024)
Moving on to its portfolio occupancy profile, in the table below, you will find a side-by-side comparison of the occupancy of the properties categorised by their property types and geographical locations reported for the current quarter under review (i.e., Q1 FY2024 ended 31 March 2024) against that reported in the previous quarter 3 months ago (i.e., Q4 FY2023 ended 31 December 2023) to find out if it is at healthy levels:
| Q4 FY2023 | Q1 FY2024 | |
| Singapore (Retail) | 95.6% | 95.8% |
| Singapore (Office) | 99.7% | 99.4% |
| Australia (Office & Retail) | 88.6% | 88.9% |
| United Kingdom (Office) | 93.5% | 95.5% |
My Observations: Apart from the occupancy of its Singapore office (which dipped by 0.3 percentage points [pp] to 99.4%) due to a slight dip in the occupancy rate of Suntec City Office (down from 100.0% in Q4 FY2023 to 99.4% in Q1 FY2024).
The REIT’s retail properties in Singapore inched up by 0.2pp to 95.8% as a result of an improvement in occupancy rate in both of its malls – Suntec City Mall (up from 95.6% in Q4 FY2023 to 95.8% in Q1 FY2024) as well as Marina Bay Link Mall (up from 96.5% in Q4 FY2023 to 97.1% in Q1 FY2024).
The 0.3pp improvement in the occupancy rate of its Australia office and retail properties was contributed by improvements in Southgate Complex (which improved from 85.1% in Q4 FY2023 to 86.5% in Q1 FY2024).
The occupancy rate of its United Kingdom office properties was up by 2.0pp to 95.5%, due to an improvement in the occupancy rate of The Minster Building (which was up from 87.3% in Q4 FY2023 to 91.3% in Q1 FY2024).
Rental reversions for new and/or renewed leases for Q1 FY2024 were all at positive figures: +21.7% for Suntec City Mall, +11.4% for its Singapore office leases, +12.2% for its Australia office and retail leases.
Debt Profile (Q4 FY2023 vs. Q1 FY2024)
Suntec REIT’s aggregate leverage ratio is among one of the highest alongside all the Singapore-listed REITs. Also, because its interest coverage ratio is under 2.5x, the limit of its aggregate leverage ratio is set at 45.0%.
However, in its Q4 FY2023 results, I noticed a slight decline in its aggregate leverage (from 42.7% in Q3 FY2023 to 42.3% in Q4 FY2023), as the REIT divested strata units at Suntec City Office Towers to pare down debt.
Are there any further improvements in its debt profile for the current quarter under review? Let us find out in the table below, where you will find a comparison of Suntec REIT’s debt profile reported for the current quarter under review (i.e. Q1 FY2024 ended 31 March 2024) compared against the previous quarter 3 months ago (i.e., Q4 FY2024 ended 31 December 2023):
| Q4 FY2023 | Q1 FY2024 | |
| Aggregate Leverage (%) | 42.3% | 42.2% |
| Interest Coverage Ratio (times) | 2.0x | 1.9x |
| Average Term to Debt Maturity (years) | 3.00 years | 3.57 years |
| Average Cost of Debt (%) | 3.8% | 4.03% |
| % of Borrowings Hedged to Fixed Rates (%) | ~61% | ~57% |
My Observations: Compared to the previous quarter, Suntec REIT’s debt profile weakened further – particularly, its interest coverage ratio fell to 1.9x, average cost of debt up by 0.19pp to 4.03%, and percentage of borrowings hedged to fixed rates down by another 2.0pp to ~57% (which is very low in my opinion, and leaving the REIT exposed to the high interest rate environment and negatively impacting its distribution payout to unitholders (DPU) – where a 10bp change in all-in borrowing cost will result in 0.181 cents impact to its DPU).
The only positives to note is the 0.1pp improvement in its aggregate leverage to 42.2% (regardless, it is still on the high side, and very close to the regulatory limit of 45.0%), and its average term to debt maturity has been extended to 3.57 years.
Another positive to note is that, it has no more borrowings due for refinancing in FY2024. In FY2025, FY2026, and FY2027, it has 14.7% (or S$625m), 12.2% (S$519m), and 21.2% (S$900m) of borrowings due for refinancing, with the remaining 51.9% (S$2,196m) of borrowings due for refinancing in FY2028 or later – which is well-staggered out.
Distribution Payout to Unitholders
Suntec REIT is one of the few Singapore-listed REITs that is paying out a distribution payout to its unitholders on a quarterly basis – which is something I like, as it provides me with a more regular cash flow.
For Q1 FY2024, a distribution payout of 1.511 cents/unit was declared – compared to its distribution payout of 1.737 cents/unit, this represented a 13.0% improvement/decline.
If you are a unitholder of Suntec REIT, do take note of the following dates on its distribution payout:
Ex-Date: 03 May 2024
Record Date: 06 May 2024
Payout Date: 30 May 2024
CEO Mr Chong Kee Hiong's Comments & Outlook (from the REIT's Press Release)
“The Singapore Office and Retail portfolios' achieved double-digit rent reversions while the convention business registered strong growth year-on-year. In London, about a third of the vacant space at The Minster Building has been backfilled within 6 months reflecting an improving market. Commitment of our vacancies in Australia was slow due to the weak market conditions.
Suntec REIT continues to work on divesting our mature assets and strata units at Suntec City Office so as to lower our gearing and deliver long-term value to our unitholders."
Closing Thoughts
In my opinion, the only positive to note from Suntec REIT’s first quarter results was its portfolio occupancy – where most of them saw an improvement in their occupancy rates, along with a positive rental reversion recorded for new and/or renewed leases for the quarter. Also, apart from its office properties in Singapore, the other property types in all geographical locations have an occupancy rate of above 90% – which is a very strong one.
Debt profile of the REIT remains a concern – particularly, its interest coverage have weakened further to 1.9x (and this is one of the lowest among the Singapore-listed REITs). Coupled with the fact that Its average cost of debt have went up further to 4.03%, and just ~57% of its borrowings hedged to fixed rates, its distribution payout will be adversely impacted by the high borrowing costs, and will likely be a lower figure compared to last year.
Suntec REIT’s financial performance was also impacted by a higher percentage increase in its property operating expenses (by 12.3%) compared to the growth in its gross revenue (by just 1.0%), with net property income, and distributable income to unitholders down by 3.8% and 1.1% respectively.
With that, I have come to the end of my review of Suntec REIT’s first quarter business update. Hope you have found the review useful, and do take note that all the opinions above are purely my own which I’m sharing for educational purposes only. Please do your own due diligence before you make any investment decisions.
Related Documents
Disclaimer: At the time of writing, I am a unitholder of Suntec REIT.
The post An In-Depth Review of Suntec REIT's Q1 FY2024 Business Update first appeared on The Singaporean Investor.
More articles on THE SINGAPOREAN INVESTOR
Created by ljunyuan | Apr 30, 2024
Created by ljunyuan | Apr 29, 2024
Created by ljunyuan | Apr 29, 2024
Created by ljunyuan | Apr 17, 2024
Created by ljunyuan | Apr 09, 2024


